Chapter 11, Table 19: Intraclass Correlations via SPSS
Syntax
For the present (hypothetical) data set (taken from Shrout and Fleiss, 1979) consists of six participants who are ranked by four judges.
As is pointed out on page 563, the structure of Table 11.19 is analogous to that of Table 11.5 (repeated measures). However, notice that in the data file that the data are entered differently. For the repeated measures design (e.g., 11.5), each row corresponded to a different participant, while each column corresponded with another measurement. The main reason for the difference in how the data was entered is mainly because of the procedures used to analyze the data. SPSS and SAS allow repeated measures data to be entered in a “participants by occasions” fashion, whereas in order to get the appropriate mean squares to carryout the intraclass correlations for the data given in Table 11.19, a mixed-effects (one fixed factor and one random factor) ANOVA needs to be performed. It should be pointed out that the repeated measures data could have been entered in a similar fashion as Table 19 and 20, however, the powerful repeated measures procedures built into SPSS and SAS would not be directly utilized.
Because the intraclass correlations, as given towards the end of Chapter 11, are not directly obtainable via SPSS or SAS, mixed-effects ANOVAs are utilized such that the appropriate mean squares can be inserted into the appropriate formulas. Note that we obtain the mean squares by way of a mixed-effects ANOVA, but either a random-effects or a fixed-effects ANOVA could have been utilized, because the corresponding mean squares are equivalent in each situation (the F ratios are what is different, which is not of interest in the present situation).
The analysis proceeds by making use of the Univariate procedure. Notice that there is a /RANDOM line which denotes the random effect of subject. Other than the /RANDOM statement, the analysis proceeds as would a standard two factor (fixed-effects) ANOVA design.
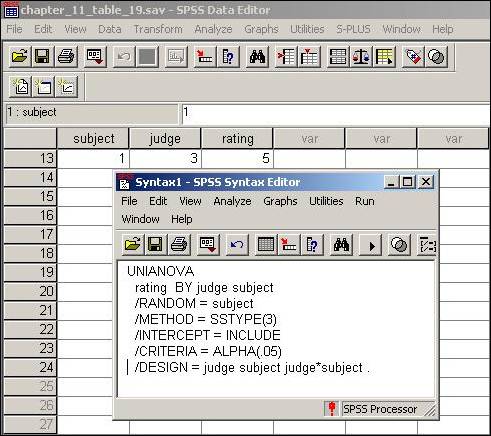
At this point clicking Run and then All will yield the results of the mixed-effects ANOVA, which can then be used to calculate the intraclass correlation coefficients.