Chapter 14, Table 4: Higher Order Designs for Repeated
Measures
(Multivariate Approach) via SPSS Point and Click
For the hypothetical data contained in Table 14.1, a perceptual psychologist studying the visual system was interested in determining the extent to which interfering visual stimuli slow the ability to recognize letters. Participants are brought into a laboratory where they are seated in front of a tachistoscope. Variations in the presentations of letters is examined with interest being on the reaction time for target letters presented either in the center of the screen or off centered with and without “noise” accompanying the target letters.
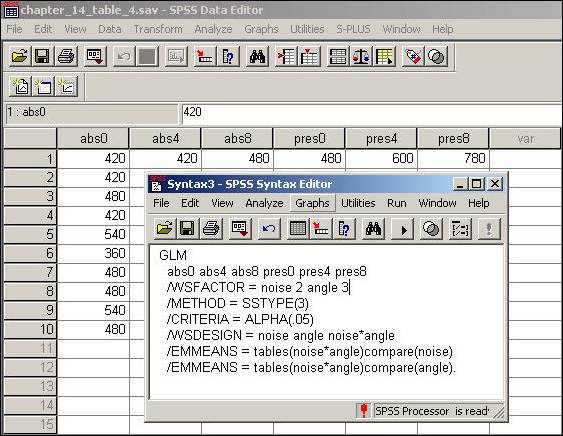
The analysis of the data given in Table 14.4 begins by making use of the GLM procedure. The within subject effects are listed under GLM. The within subject factor line (/WSFACTOR) specifies first the factor that is “changing slowest” (here noise because the data is input so that the first three variables entered consist of the same level of noise, while the levels of angle change) with the number of levels of noise (“2” in this case) and lastly the factor angle, which is “changing fastest” (with “3” levels in this case). As usual we will choose Type III sums of squares and specifying the main effects and the interaction on the within subjects design (/WSDESIGN) line. Because some may be interested in marginal means, we include the /EMMEANS options which computes marginal means for noise and angle at each level of noise (for the first /EMMEANS statement) and then at each level of angle (for the last /EMMEANS statement).
At this point clicking Run and then All will yield the results of the analysis (which are given on page 694 in the text). Note that there are several analyses performed and various output given by default. The results for the main effects and interaction are those given under the Multivariate Tests heading. Because of the difficulty of performing tests of simple effects and confidence intervals around confidence intervals for contrasts with the data structure presented in Table 11.4 and the ease of performing such analyses for the data structure presented in Table 11.5 (recall Table 11.5 consists of preformed D variables of substantively interesting questions), we show how to obtain the results given in the text by making use of the D variables given in Table 11.5.