Chapter 4, Table 1: Performing Pairwise and Complex
Comparisons Through SPSS Syntax
The hypothetical example shown in Table 4.1 consists of systolic blood pressure scores for 20 participants in four treatment groups for hypertension. The participants were randomly assigned to the four treatment groups of interest: drug therapy, biofeedback, diet, and combination. Note that for this example, there are not equal sample sizes in each group.
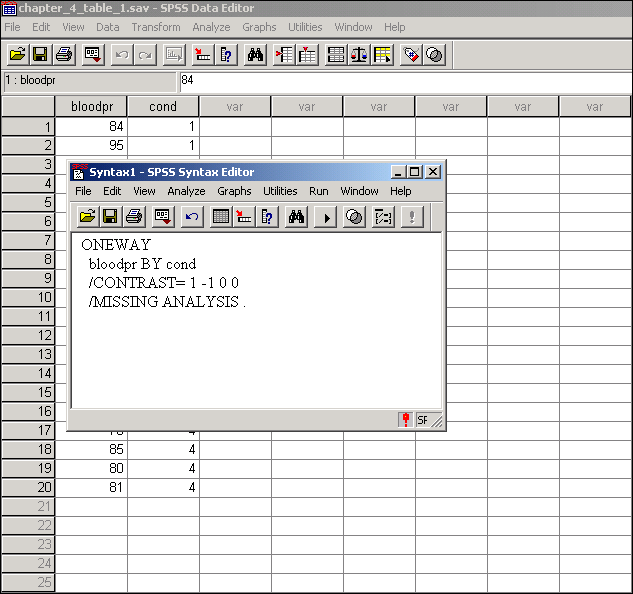
Our first hypothesis of interest is whether the drug therapy and feedback groups differ in their effectiveness in treating hypertension. To test this hypothesis, we perform a simple pairwise comparison (/CONTRAST is the statement that specifies this) for the drug therapy and feedback groups. An illustrative example of the calculations for this analysis is shown in Table 4.2, while the output and contrast coefficients for this analysis are shown in Table 4.4.
At this point, click Run and then All to obtain the results.
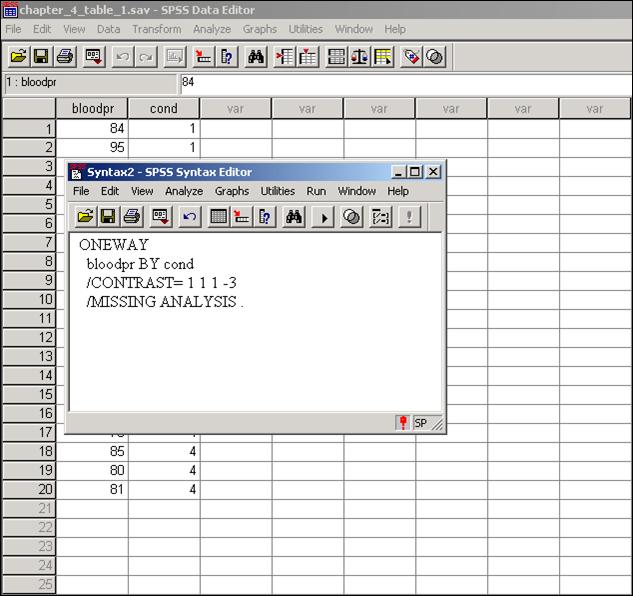
Our second hypothesis of interest is whether the average of the drug therapy, biofeedback, and diet groups differs from the combination group in effectiveness in treating hypertension. Using the data from Table 4.1, we test this hypothesis by performing a complex comparison of means (/CONTRAST) by comparing the average of the means of the drug therapy, biofeedback, and diet groups to the mean of the combination group. An illustrative example of the calculations for this analysis is shown in Table 4.3, while the output and contrast coefficients for this analysis are shown in Table 4.4.
At this point, click Run and then All to obtain the results.