Chapter 8, Table 12: Performing a
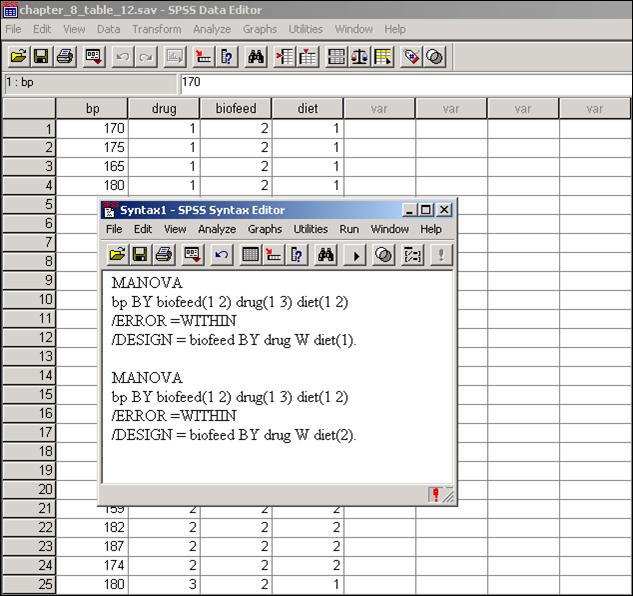
The data in Table 8.12 consist of blood pressure scores for 72 participants. Three categorical independent variables: the presence and absence of biofeedback (biofeed), drug X, Y, or Z (drug), and diet absent or present (diet) have been factorially combined to form a 2 x 3 x 2 design where each person contributes one blood pressure score to one of the 12 different experimental conditions. For this example, there are 6 participants in each group.
At this point in illustrating the SPSS syntax, it is necessary to start using the MANOVA procedure. This procedure is more general than the procedures used up to this point and thus is typically more flexible when attempting to carry out a variety of analyses. This is the primary reason that this procedure is being used, as the procedures used up to this point do not allow for some of the analyses associated with Chapter 8, Table 12 to be directly carried out.
First, the omnibus tests of interest will be computed to determine if there are differences among the groups on the mean level of blood pressure. Table 8.14 illustrates the results replicated here.
At this point, click Run and then All to obtain the results.
Because we are now using the MANOVA procedure through SPSS syntax, we can proceed with the more specific analyses of interest. The next analyses to be carried out are the simple interaction tests. Specifically we are interested in testing the interaction between biofeedback and drug within the diet absent and diet present conditions. The results of these analyses we are replicating are in Table 8.16.
At this point, click Run and then All to obtain the results.
Further, one may by interested in testing the simple, simple main effects. In particular, we illustrate how to calculate the simple, simple main effects within the diet absent condition. The results for these analyses can be found in Table 8.17.
First, we illustrate the syntax to perform the simple, simple main effects for biofeedback at specific levels of drug and diet absent:
At this point, click Run and then All to obtain the results.
Next, we illustrate the syntax to perform the simple, simple main effects for drug at specific levels of biofeedback and diet absent:
At this point, click Run and then All to obtain the results.
The next set of analyses of interest is individual cell mean comparisons as tested in Table 8.18. All these cell mean comparisons are tested within the diet absent condition. We first illustrate the syntax to perform the individual cell mean comparisons between different levels of drug within the biofeedback present and diet absent condition. It is important to realize that the contrast/special statement used here specifies the drug comparisons and the tests obtained depend on the coefficients used in the SPECIAL matrix:
At this point, click Run and then All to obtain the results.
Also, we illustrate the syntax to perform the individual cell mean comparisons between different levels of drug within the biofeedback absent and diet absent condition:
At this point, click Run and then All to obtain the results.
Notice that the syntax for the individual cell mean comparisons also provides parameter estimates and confidence intervals. In fact, the /CONTRAST statement and SPECIAL matrix provide these by default. Table 8.22 illustrates the Tukey HSD confidence intervals for these individual cell mean comparisons. While the Tukey HSD confidence intervals cannot be produced directly using SPSS syntax in more complex designs such as the three-way ANOVA of interest here, one can still obtain the Tukey HSD confidence intervals by hand through using the parameter estimates, the standard errors, and looking up the Tukey HSD critical value so that Table 8.22 can be replicated. It is important to remember to check the parameter estimates to determine if they are scaled properly because SPSS MANOVA does not always yield the scaling of the parameter estimate that one might be interested. If the scaling is not correct, the parameter estimate and standard error must be scaled appropriately.
A further set of analyses of interest are the simple main effect of biofeedback when diet is present and the simple main effect of drug when diet is present. The results corresponding to the syntax for these analyses illustrated here can be found in Table 8.19:
At this point, click Run and then All to obtain the results.
We are also interested in obtaining the confidence intervals corresponding to Tables 8.21 and 8.22. Table 8.21 deals with the simple, simple main effects of biofeedback at specific levels of drug and the diet absent condition along with the simple main effect of biofeedback within the diet present condition. Table 8.22 deals with individual cell mean comparisons between the levels of drug for the biofeedback present and absent conditions and diet absent. We deal with each of these tables in turn.
We first illustrate the syntax that can be used to obtain the (unstandarized) confidence intervals for the simple, simple main effects of biofeedback when diet is absent that are shown in Table 8.21:
At this point, click Run and then All to obtain the results.
Here is the syntax that can be used to obtain the (unstandarized) confidence intervals for the simple main effects of biofeedback when diet is present shown in Table 8.21:
At this point, click Run and then All to obtain the results.
Notice that the difference in the syntax shown here and the syntax shown previously for these effects is the \PRINT PARAMETERS(ESTIM) command which provides the confidence interval and parameter estimate. It is also important to note that all of the confidence intervals (and parameter estimates) must be multiplied by -2 to exactly replicate the results obtained in Table 8.21 for the unstandardized effects. This is due to (1) the sign of the confidence interval is arbitrary as it depends on which mean is subtracted from the other and (2) SPSS MANOVA actually uses variable codings that specify only one-half the mean difference (as opposed to the whole mean difference) in these situations. In order to find the approximate standardized intervals refer to chapter 8, page 384. We also may be interested in confidence intervals for the individual cell mean comparisons between drugs for biofeedback present and biofeedback absent when diet is absent. As mentioned earlier, the results in Table 8.22 can be obtained using the SPSS syntax for the individual cell mean comparisons illustrated above.