Chapter 9, Table 7: Analysis of Covariance and
Estimating Adjusted Means via SPSS Syntax
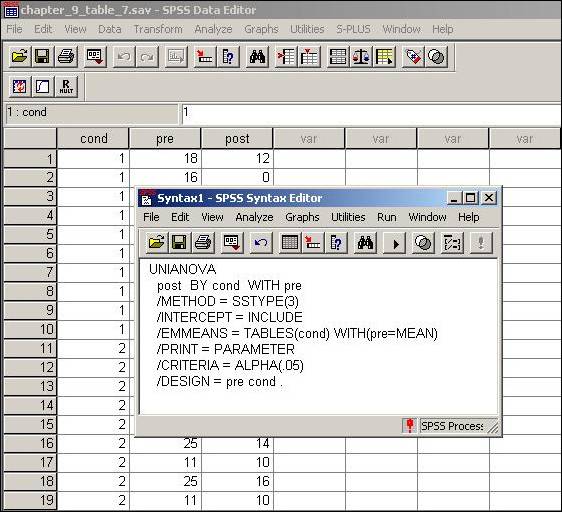
The following data represent a three group pre-post
design, where 30 depressives were randomly assigned to one of three conditions.
The primary question of interest is: “do individuals in some groups change more
on their measures of depression than do individuals in other groups?”
The
analysis data given in Table 9.7 begins by making use of the SPSS Univariate
ANOVA procedure (UNIANOVA).
The difference in this design compared to those examined previously is that a
covariate is included in the analysis. The major difference in the present
situation is that a WITH statement is
included on the second line of the syntax. The WITH
statement begins the covariates of interest, in this case pre. Also notice the /PRINT =
PARAMETER line included in the syntax. Without this option the ANCOVA is
performed and thus the F and p values are given for each of the
effects in the analysis. However, we are also interested in the parameter
estimates, namely the slope and the intercept. Including the /PRINT = PARAMETER option provides the
parameter estimates in addition to their tests of significance. Notice further
that an additional optional line is given, namely: /EMMEANS = TABLES(cond) WITH(pre=MEAN). This /EMMEANS line will produce the
adjusted means of the cond
given (or conditional on) the covariate pre.
These adjusted means correspond to those given in Table 9.8 of the text.
At this point clicking Run and then All will yield the ANCOVA results, including the parameter estimates and the adjusted means. Note that at the time of this writing Tables 9.8 and 9.10 cannot seem to be replicated via the SPSS Univariate procedure.