Helix
Here is a way to plot a helix on a cylinder. It will use a parametric description of the cylinder. The cylinder is a right circular cylinder of radius 1 centered on the z-axis. It is the set of all points of the form

I'll limit the graph to

I begin by making a 50x50 mesh of the points [U,V] I'll use in the graph.
u=linspace(0,2*pi,50); v=linspace(0,6*pi,50);
[U,V]=meshgrid(u,v);
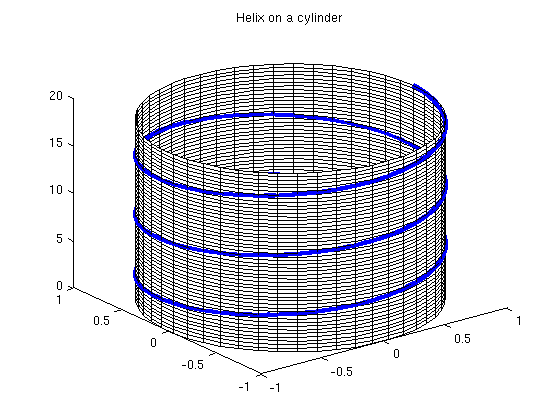
To be able to get a thick curve for the helix, I use the plot3 command. I plot the helix as a very thick curve and use the command surf to plot the cylinder. The command colormap white prevents shading of the cylinder.
t=linspace(0,6*pi,300);
plot3(cos(t),sin(t),t,'LineWidth',3), hold on
title('Helix on a cylinder')
surf(cos(U),sin(U),V), colormap white, hold off