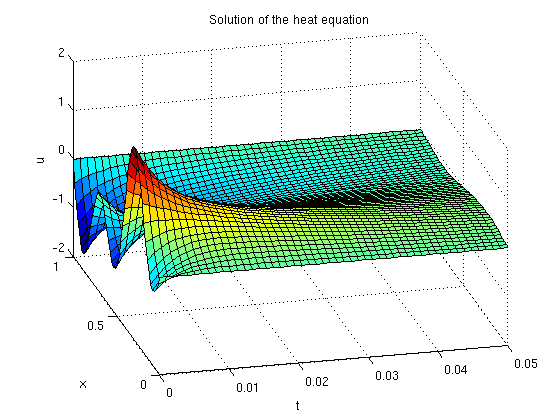
Graph of Solution of the Heat Equation
I will graph the solution of  for
for  with
with  and
and  for
for  and
and  for x in [0,1]. The solution is

x = linspace(0,1,50); t = linspace(0,0.05,50); [X,T]= meshgrid(x,t);
u = exp(-4.*pi.^2.*T).*sin(2.*pi.*X) - exp(-25.*pi.^2.*T).*sin(5.*pi.*X) ;
surf(T,X,u)
view(-14,32)
xlabel('t'), ylabel('x'), zlabel('u')
title('Solution of the heat equation')