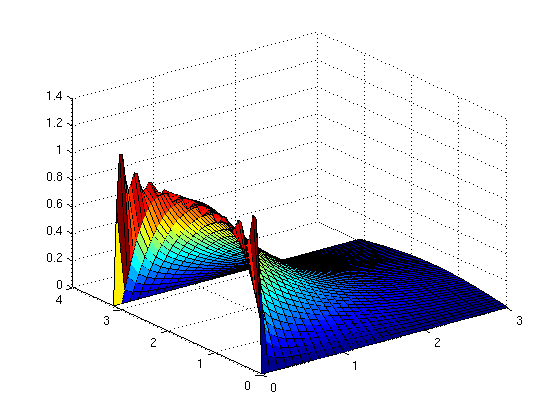
Graph of solution of heat equation
Let  solve the initial value problem for the heat equation in a rod of length

with the boundary conditions

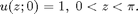
and the initial value
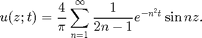
We know the solution is
I start by defining the grid of z and t values where the values of u will be computed. Be careful not to use too many points in your meshgrid command; if you do you won't get a clear plot.
z = linspace(0,pi,50); t = linspace(0,3,100); [Z,T]= meshgrid(z,t);
Alternatively, I could create the meshgrid by giving the command
[Z,T]= meshgrid(0:pi/50:pi,0:.1:3);
Next I define u using a for loop to add terms, starting with u=0.
u=0;
for n=1:10
    u = u + 4*exp(-(2*n-1).^2.*T).*sin((2.*n-1).*Z)./((2*n-1)*pi);
end
surf(T,Z,u)