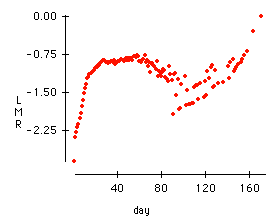
The natural dependent variable is "mortality rate" calculated by counting the number of dead flies on a given day and dividing that by the number of flies alive at the beginning of the day. For example, on day 35, there were 88612 flies alive and 11222 died, which yields a mortality rate of 11222/88612 = 0.12664.
A scatterplot of the "mortality rate" versus "day" is informative.
A nonlinear regression model which is exponential in the parameters might provide additional insight, but this model can be linearized by taking logs of both sides. Hence, a regression (and accompanying scatterplot) of "Log(mortality rate)" on "day" yields a similar analysis as the nonlinear regression and it might be used to test the validity of the exponential mortality rate theory by Gompertz.
