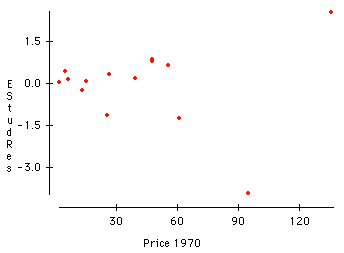
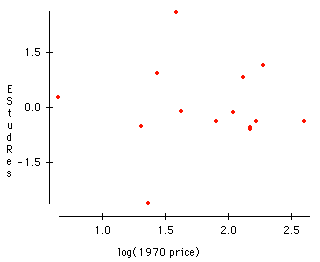
There is a strong correlation (.967) between 1970 and 1980 prices. A scatterplot reveals that two species, lobsters and sea scallops, are outliers, but they follow the general trend of the rest of the data. One model that may be estimated from the data is a simple regression of 1980 price on 1970 price. However, a plot of the studentized residuals vs. 1970 price shows a cone-shaped pattern indicative of non-constant variance. Transforming both variables by taking the natural log results in a regression with high R-squared and F-ratio, and residuals with a constant variance.

