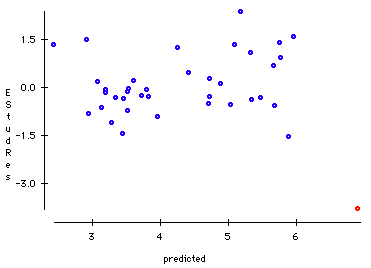
The answer is not available in the data provided, but was discovered through some additional research on the Buick Estate Wagon. These data were collected by Consumer's Union on a test track (rather than using the EPA test values for fuel efficiency) following the manufacturer's recommendations for each car's maintenance. Additional research revealed that starting with this model year, Buick recommended a higher tire inflation pressure for the Buick Estate Wagon. The recommended inflation pressure level was higher than the level for other cars in the survey. Harder tires present less rolling resistance and improve gas mileage; therefore, the Buick Estate Wagon outperformed our expectations based on our regression model, which did not account for tire inflation pressure. In our model Tire Pressure is a lurking variable, a variable that seems to help in predicting gas mileage but is not included in the model.
There are three ways to deal with this outlier in our model:
(1) We could remove the Buick Estate Wagon from the data set and recompute the model since we have evidence that the conditions under which it was tested were different;
(2) We could add an indicator variable to the model with a value of one for the Buick Estate Wagon and zero for all other observations (this is equivalent to (1));
(3) We could add the additional predictor variable Tire Pressure to our model if that data is available.