Because there are four different measurements that characterize skull size, we must use multivariate techniques that allow multiple dependent variables. Our dependent variables are the measurements MB, BH, BL, and NH. The predictor variable is Year.
Two different analyses may be performed on these data. If we assume that Year is a discrete predictor variable, then we may analyze the data using multivarite analysis of variance (MANOVA). If we wish to determine if there is a linear trendto the change in skull size, then we treat Year as a continuous predictor variable and analyze the data using multivariate regression.
A MANOVA analysis of the data shows that there is a significant difference between the multivariate measurements of skulls at different time periods at the 1% level of significance. If we look at the differences of individual measurements across the time periods, MB, BH, and BL all show significant differences at the 5% level. However, the NH measurement does not differ significantly across the time periods at the 5% level of significance.
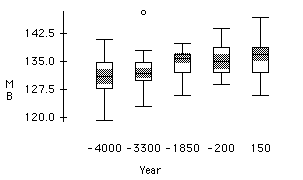
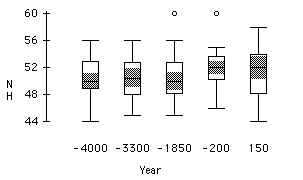
The first plot below shows the difference in the MB measurement across the time periods. The shaded regions are the 95% confidence intervals of the median measurement at each time period. We can see that MB seems to increase over time. In the second plot NH does not appear to change as significantly across the time periods.
A multivariate regression of the data, treating Year as a continuous predictor, shows that, when all four measurements are taken together, the measurements appear to change over the years. This result agrees with the MANOVA result above. Looking at each measurement individually, all four measurements change significantly across the years. Recall that NH did not change significantly in the MANOVA analysis.
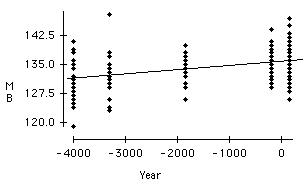
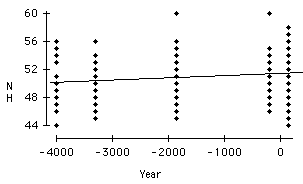
The third and fourth plots below are scatterplots of measurements vs. Year. The measurement MB appears to change more significantly with year than NH. Both MB and NH increase over time; however, plots of BH and BL vs. Year show that BH and BL decrease over time. In this study the direction of the change is not important since any change in skull size would be evidence of interbreeding.
Hypothesis tests in MANOVA and multivariate regression require that the dependent variables have a multivariate normal distribution. A plot matrix of the dependent variables shows univariate and bivariate normality. While this does not prove multivariate normality since it does not check the three and four-dimensional structure of the data, it does provide strong evidence of multivariate normality. Therefore, the hypothesis tests in the two analyses above should be valid.
In order to simplify the analysis, we can use a principal components analysis to reduce the number of dependent variables. The principal components analysis of the four measurement variables shows that the dimensionality of the dependent variables cannot be reduced; therefore, our analyses above cannot be simplified in this way.


