Abstract:
The average polishing times for 59 products are related in general to the sizes
of the products as indicated by product diameter (or equivalent). However, dif-
ferent types of products have special problems in polishing. For example, cas-
seroles are deeper than ordinary plates and on that account would require more
polishing time than a plate of equal diameter. Also it is possible that the increase
in polishing time per additional inch of diameter could be different for casseroles
than for ordinary plates.

The questions of differing levels and slopes of regression lines for different sub-
sets of observations can be tested by employing dummy variables for the subsets
and adding product (interaction) terms for the subset dummies and the predictor
variable. If interaction terms for different slopes are included, it is necessary to
center the predictor variable at its mean so that differences in level of regressions
will refer to level at the mean rather than the level of the intercept on the original
scale of the variable.

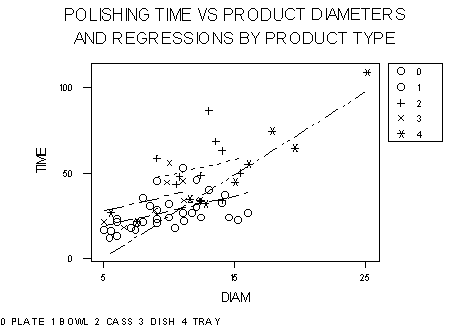
In the datafile for this example plates were the uncoded type of product. The indi-
cator variables for the remaining types (bowls, casseroles, dishes, and trays) were
tested along with their interactions with product diameters in a stepwise regression
with polishing times. The result is shown in the accompanying graph. The regression
for dishes lies moderately above the regression for bowls and plates, and the re-
gression for casseroles lies still further above the bowls and plates regression. The
slope of the regression for trays is higher than for the other product types, but its
average level (at the mean diameter of around 11 inches) is no different from that
for plates and bowls.

The student may wish to consider the regression of price on time, and ask the same
questions about the influence of different product types on this regression as were
considered above for the regression of time on diameter of product.
Image:

