Me
Abstract:
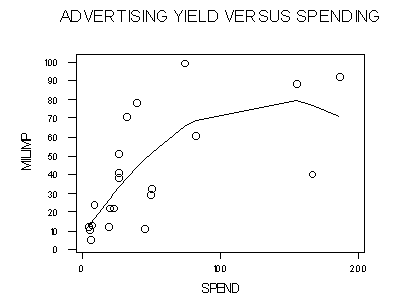
The scatter diagram below suggests that the relation between advertising
yield and spending is not linear. An alternative is to fit a regression line with
a second order term, which is shown. However, the logic of the second order
regression line, which turns down within the range of the data, is open to
question. The student can validate that the relation between advertising yield
and the logarithm of spending appears linear, however. What does the regres-
sion coefficient for such a line tell us? Is that a more logical view of the under-
lying relationship?

Another issue is that the McDonald's campaign appears as an outlier in terms
of spending, and is an influential observation in the linear regression. Does
the same prevail for the second order regression and the regression using
the logarithms of spending?
Image:

