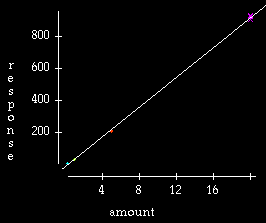
Figure 1 shows a plot of response vs. amount with a regression line superimposed. Note the large range of x-values. The regression of amount on response has an R-square of 99.9%. However, despite this, the plot shows that the regression line passes through the data only for the largest amount tested. The responses for other amounts either lie completely above or below the line.
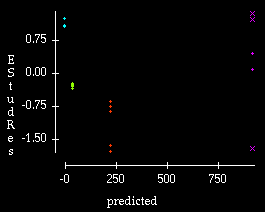
Figure 2 shows this more clearly, and also shows that the variability of the residuals increases as the predicted values increase. These are failures of the regression assumptions of linearity and constant variance. They make the results of the regression suspect. Despite appearances, the data do not seem linear. Perhaps transforming the data would provide a better fit.

