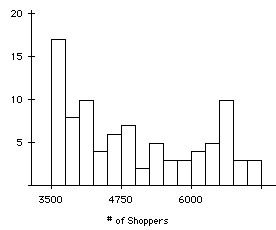
The first question was addressed by comparing traffic patterns and shopping behaviors on all Friday the 13th's between July of 1990 and November of 1992 to the patterns and behaviors on the Friday of the week before. The second question was addressed in a similar fashion using the numbers of emergency admissions to hospitals due to transport accidents from October of 1989 to November of 1992.
One way to look at these data is using t-tests. However, this approach should be used with caution. While the traffic data appear normally distributed, the shopping data do not. Histograms of the variables 6th and 13th for the shopping data are symmetric but multimodal. The accident dataset contains only six observations, making it difficult evaluate its distribution.
Paired t-tests of the difference between the 6th and 13th for the traffic and accident datasets show that while there were fewer cars on the road on Friday the 13th, the local hospital reported more accidents on Friday the 13th.
Another method for analyzing these data sets is two-way ANOVA. A two-way ANOVA using shopping as the dependent variable, location as a random blocking factor, and an indicator variable for whether the observation corresponds to the 6th or the 13th allows testing of the "Friday the 13th effect" while accounting for differences among the supermarkets.
