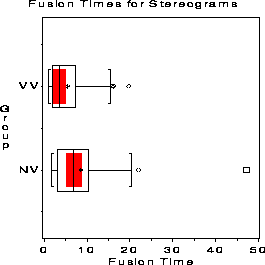
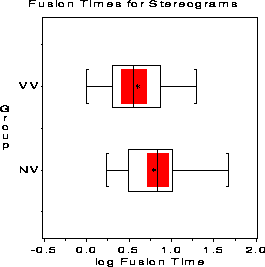
An experiment was performed to determine whether knowledge of the form of the embedded image affected the time required for subjects to fuse the images. One group of subjects (group NV) received either no information or just verbal information about the shape of the embedded object. A second group (group VV) received both verbal information and visual information (e.g., a drawing of the object).

The investigators performed the usual two-sample pooled-variance t-test, giving t(76) = 1.9395, p-value = 0.0562, and concluded that, at the 0.05 significance level, no difference between the groups was demonstrated. However, analysis of these data using the unequal-variance t-test reveals a marginally significant result (p-value=0.0453). Note that the test of equality of variances gives a highly significant result.
                                TTEST PROCEDURE

Variable: TIME         Fusion Time

GROUP       N         Mean      Std Dev    Std Error
----------------------------------------------------
NV         43   8.56046465   8.08541161   1.23301371
VV         35   5.55142886   4.80173890   0.81164201

Variances        T       DF    Prob>|T|
---------------------------------------
Unequal     2.0384     70.0      0.0453
Equal       1.9395     76.0      0.0562

For H0: Variances are equal, F' = 2.84    DF = (42,34)    Prob>F' = 0.0023
Boxplots of the raw data show that the time values are positively skewed, longer fusion time in the NV group is accompanied by greater variability, and there is one very large potential outlier in the NV group.
These defects are all cured by transforming the data to log(time).

