Story Name: Oil production
Datafile Name: Oil production
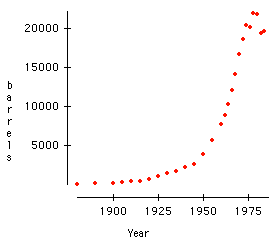
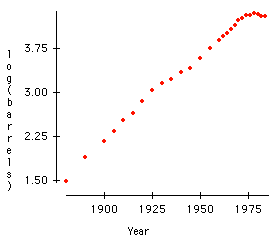
Abstract: The increase in annual world crude oil production from 1880 to 1973 follows a pattern of exponential growth. In order to fit a linear model to these data, the oil production variable must be transformed by taking the natural log. A scatterplot of the log of oil production vs. year follows a straight line from 1880 to 1973. Political turmoil in the oil-producing regions of the mideast affected patterns of oil production after 1973.
A regression of log(oil production) on year shows how closely the exponential growth model fits the data. However, the assumption of independent error terms is violated. A scatterplot of the studentized residuals shows a definite cyclical pattern.
Image: Scatterplot of oil production vs. year

Image: Scatterplot of log(oil production) vs. year


