Thermal
Circulations in Complex Terrain
About 70% of the earth
surface is covered with complex topography. Local airflow is driven by pressure
gradients and diurnal variation of solar heating
causing mesoscale thermal circulation
(valley/slope flows). Recent studies
have identified anabatic flows as playing a key role in
air pollution dispersion and transport of urban pollutants. Pollutants carried by anabatic flows can be
detrained into the upper part of the BL or can be injected into the synoptic flow
possibly showering downwind cities with pollutants. In urban areas with high ozone, the daytime upslope
flow can contain embedded plumes of high ozone concentration which are advected upslope toward the higher elevations (Figure
1A).
In the mornings, anabatic
winds breakup cold pools in mountain valleys, advecting
the moisture upslope, leading to the initiation of mountain generated cumuli
and their continued growth into cumulus congestus and
cumulonimbus clouds (Figure 1B).
![]()
![]()
Figure
1: A)
Daytime convection and upslope dispersion of pollutants. B) Morning cold pool breakup by anabatic
flow, an important process to cumulus initiation.
Our laboratory experiments investigate the mechanisms governing
anabatic/katabatic flow above a uniformly heated/cooled slope to obtain
critical flow parameters of consequence (Figure 2). These measurements include numerous slope
angles and buoyancy flux settings with and without stratification and the
presence of a synoptic flow, allowing identification of new processes and
verification of theoretical predictions.
Laboratory techniques used include an in-house developed Particle
Tracking Velocimetry (PTV) system including Feature
Tracking Visualizations (FTV), (a method of animating color mapped PTV tracks
by length or velocity to gain a time history of the flow) (Figure 3) and
Stereoscopic Particle Image Velocimetry (Stereo PIV).
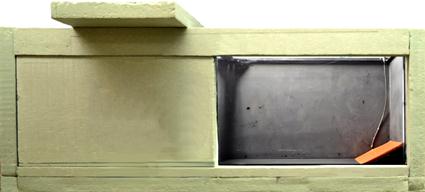
Figure 2: Insulated water tank with electric foil acting as heated slope.
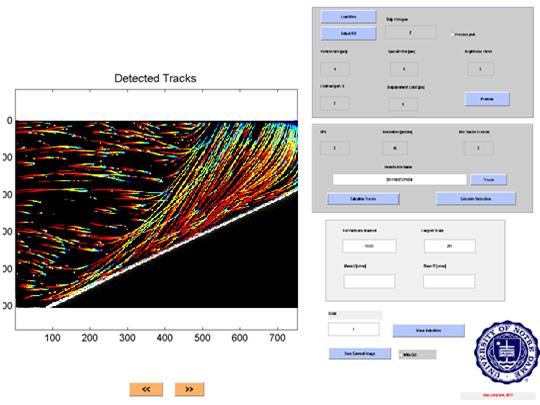
Figure 3: In-house developed Particle Tracking Velocimetry
(PTV) systems with Feature Tracking Visualization (FTV) shown where tracks are
color mapped by length or velocity.