Chapter 14, Table 3: D Variables for Higher Order Designs for Repeated
Measures (Multivariate Approach) via SPSS Point and
Click
For the hypothetical data contained in Table 14.1, Table 14.3 gives the set of D variables. The D variables are subsequently used to analyze the data given in Table 14.1. Recall that we analyzed the data contained in Table 14.1 directly using SPSS without (explicitly) forming D variables. Although obtaining the results of the main effects is easily accomplished using the data directly, forming and then analyzing D variables directly also has its benefits (which are delineated in the chapter). Below we analyze the D variables contained in Table 14.3. As expected, our results will match those previously obtained when we analyzed the raw data (i.e., skipping the step of explicitly forming D variables). However, the method to be outlined here provides a different way to accomplish the same goal. We will soon see that analyzing the data in the method to be explained below potentially offers unique advantages.
To begin we make use of the Multivariate procedure rather than the Repeated Measures procedure as we previously did. We do this because we have already taken into account the “repeated” part when we formed the D variables. At this point we want to see if the D variables differ from zero. Begin by clicking Analyze, and then General Linear Model, and then clicking Multivariate. At this point we move each of the D variables to the Dependent Variables box as shown below:
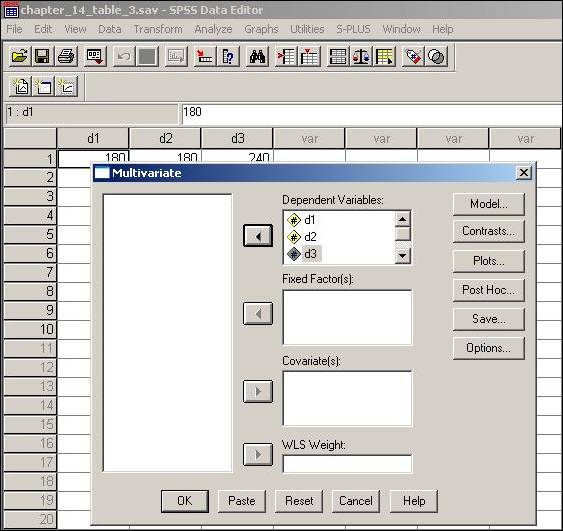
Clicking OK will yield the results of the analysis and match those given on page 686 in the text.