Chapter 3, Table 1: A One Sample t-test Via SPSS Point and Click
The data set analyzed to replicate Chapter 3 Table 1
consists of IQ (WISC-R) measurements on six hyperactive children. The question of
interest is: “are hyperactive children in the school district brighter than the
average student?” The mean IQ among the students is known to be 98. Thus, the
null hypothesis in this situation is that the population mean for the
hyperactive students is also 98.
To answer such a question we perform a one sample t-test specifying the null hypothesis as 98. Because a t-value squared with X degrees of freedom is equivalent to an F value with one numerator and X denominator degrees of freedom, our results are equivalent to those reported in the book. Recall that the observed F-value (with 1 and 5 degrees of freedom) in the book is 9, whereas our t-value (with 5 degrees of freedom) is 3.
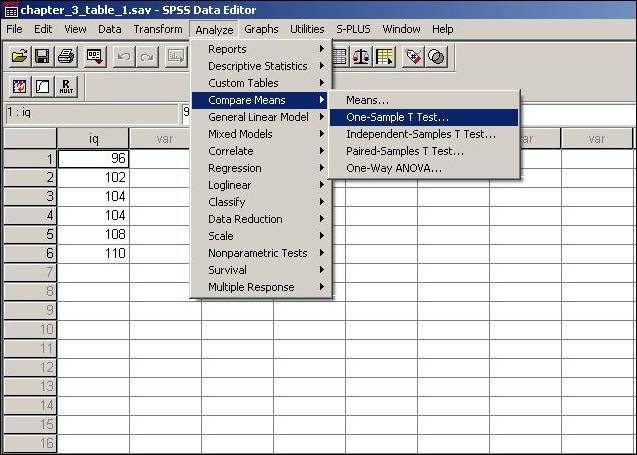
1. Click Analyze, then Compare Means, then One Sample t-test.
2. From the pop-up menu within the One Sample t-test option, the Test Value represents the null hypothesis of interest.
The value of 98 is specified in the Test Value box because it is the population mean specified in the example problem.
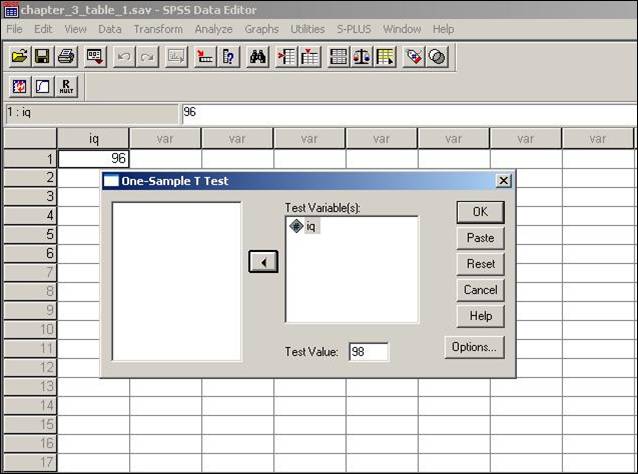
At this point, clicking OK leads to the results.