Chapter 3, Table 7 and 9: Univariate Descriptive
Statistics via SPSS point and click
The data set analyzed to replicate Chapter 3 Tables 7 and 9 consist of the number of drinks per week at a nine month follow-up for participants in five different therapy groups. The purpose of this data set is to assess the likelihood of the assumptions of the parametric statistical tests (in this case the assumptions of normality and homogeneity of variance). This data set is also of interest in order to explore potential transformations (e.g., the log transformation), such that the parametric assumptions may be more satisfied.
Here we perform some univariate descriptive statistics for each of the six variables in Tables 3.7 and 3.9 by “exploring” the data.
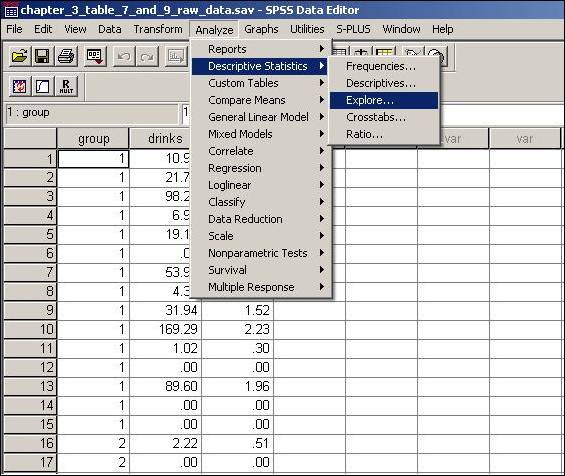
1. Click Analyze, then Descriptive Statistics, then Explore.
2. From the pop-up menu within Explore, drinks and lgdrinks are the variables that go into the Dependent List, whereas group is specified within the Factor List.
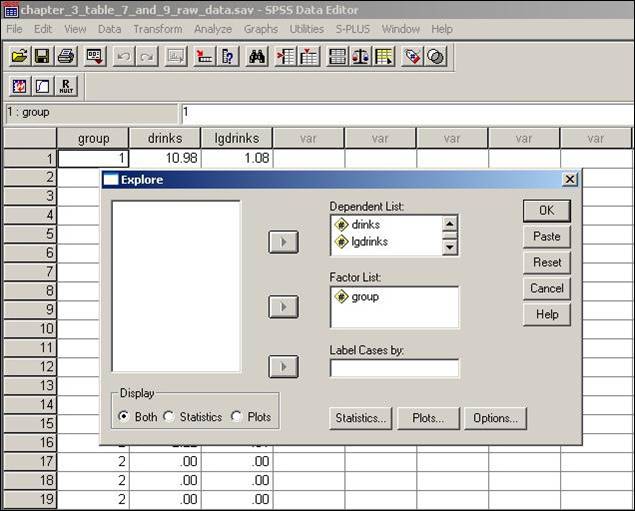
At this point, clicking OK leads to the results. By default Explore outputs several other statistics that are not given in Tables 3.7 and 3.9. Note that the median for T1 CRA-D should be 10.98, not 11.89 as is listed in Table 3.9. In addition, the kurtosis for T2 CRA-D in the book should be 2.78, not 1.06 as is listed in Table 3.9.