Chapter 6, Table 1: Performing a Trend Analysis Through SPSS Point and Click
The data in Table 6.1 consist of recall scores for 24 children who have been randomly assigned to one of four experimental conditions where there are 6 children in each condition. The experimental conditions of interest are 1, 2, 3, and 4 minutes where the number of minutes is the amount of time the child is allotted to study a list of words before attempting to recall the words. The dependent variable (i.e., the recall scores) are the number of words the child is able to recall after a brief interference task.
The first hypothesis of interest is whether the number of words recalled is linearly related to the number of minutes spent studying. We first test this hypothesis by determining if the linear trend is statistically significant. Pages 252 and 253 are associated with this test.
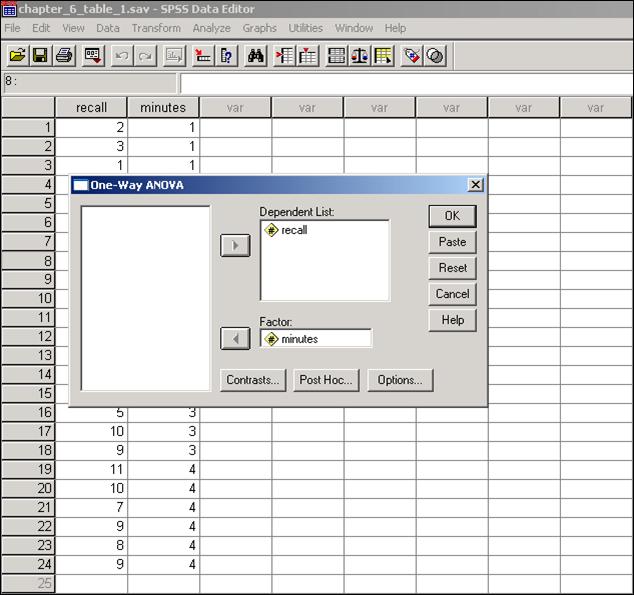
Click Analyze, then Compare Means, then One-Way ANOVA.
Place the dependent variable (recall) in the Dependent List box and the quantitative factor (minutes) in the Factor box. Then click Contrasts underneath the Factor box.
Check the Polynomial box and specify the Degree as Linear. Click Continue and then OK on the One-Way ANOVA screen to obtain the results.
It is important to note that one might also be interested in estimating the slope corresponding to the linear trend within a trend analysis. If this is the case, one should type in the contrast coefficients that correspond to the linear trend instead of clicking the Polynomial box and specifying the Degree as linear. Of course, one must then remember to divide by the sum of the squared contrast coefficients in order to obtain the correct estimate of the slope.
Next, we are interested in determining if there is any nonlinearity present in the relationship between the number of words recalled and the amount of time spent studying. In fact, the analysis just presented supplies the statistical test of this hypothesis in the “Deviation” row under “Linear Term” in the output. Page 257 demonstrates the results associated with this statistical test.
Finally, we are interest in determining if the quadratic or cubic components of the relationship between the number of words recalled and the amount of time spent studying are statistically significant. In order to obtain the results for these tests, simply specify the Degree of the polynomial as Cubic in Step 3 of the procedure shown above. It is important to note that the results for the linear, deviation from linear, quadratic, and cubic trends replicated by the procedures shown here are illustrated in Table 6.3.