Chapter 7, Table 1: Two by Two Factorial Design
Treated as
a One-Way
ANOVA via SPSS Point and Click
The following data consists of blood pressure measurements taken after the end of treatment for five individuals that were randomly assigned to one of four groups. The initial question of interest is whether there is a significant difference between any of the group means, that is, are all of the population group means equal or is there a difference somewhere.
As before, we can perform a one-way ANOVA via the One-Way ANOVA menu (click Analyze, then Compare Means, then One-Way ANOVA) to replicate the results given in Table 7.2. Score is specified as the dependent variable by moving it into the Dependent List. Because group is what distinguishes group membership, it should be moved into the Factor specification.
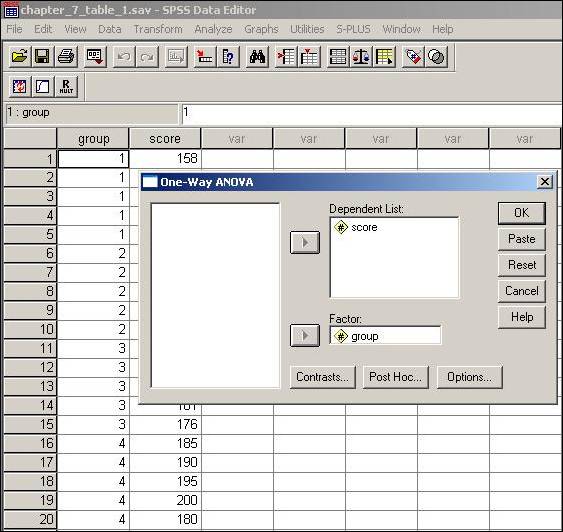
At this point clicking OK will produce the results of the one-way ANOVA given in Table 7.2.
Note that this analysis does not take into consideration the interaction between biofeedback and drug. For pedagogical reasons this data set is analyzed as though it were a one-way design with four groups. As is explained in the text, the concept of an interaction is important and should not be overlooked. Table 7.7 shows the results of the data from Table 7.5, where the interaction of biofeedback and drug is explicitly taken into consideration.