Chapter 9, Table 7: Analysis of Covariance and
Estimating Adjusted Means via SPSS point and click
The following data represent a three group pre-post
design, where 30 depressives were randomly assigned to one of three conditions.
The primary question of interest is: “do individuals in some groups change more
on their measures of depression than do individuals in other groups?”
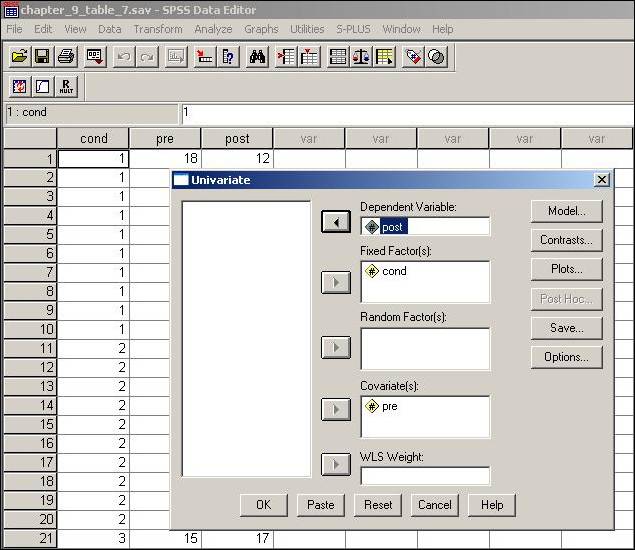
The analysis data given in Table 9.7 begins by making use of the SPSS Univariate ANOVA procedure (UNIANOVA). The difference in this design compared to those examined previously is that a covariate is included in the analysis. As before, we will begin by moving the grouping factor, group, into the Fixed Factor(s) box, and the dependent variable, y, into the Dependent Variable box. Because a covariate is also included in the analysis, the covariate, x, is moved into the Covariant(s) box.
Because we are also interested in the parameter estimates of the intercept and slope, and not just the F and probability values associated with the effects, it will be necessary to add an additional option. By clicking on the Options button in the Univariate, the option for Parameter estimates can be “checked.” Further, we are also interested in the adjusted means of the grouping factor cond. By highlighting cond in the Factor(s) and Factor Interactions box and moving it over to the Display Means for box, the estimated means given (or conditional on) the covariate are obtained. These adjusted means correspond to the values given in Table 9.8 of the text.
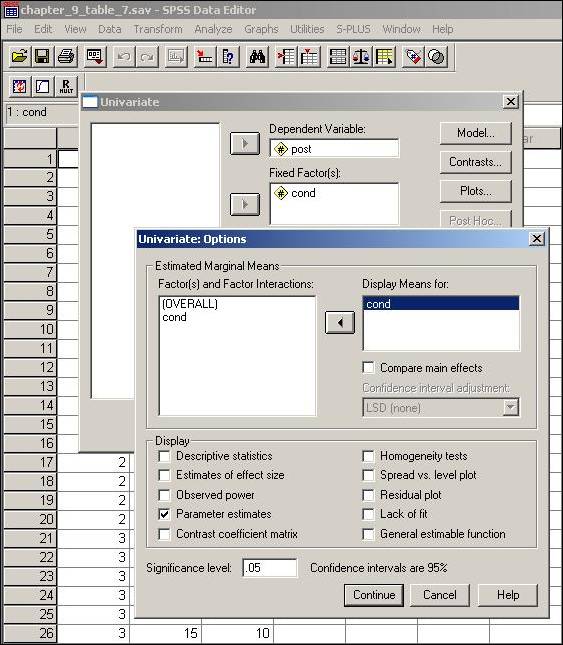
At this point clicking Continue on the Univariate: Options box and then OK on the Univariate box will yield the results of interest. Note that at the time of this writing Tables 9.8 and 9.10 cannot seem to be replicated via the SPSS Univariate procedure.