Graphs of a function of 2 variables - simple cases
Contents
EZ ways
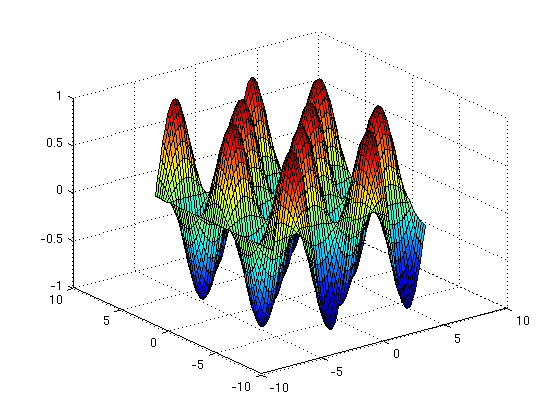
You can plot the graph of a function of 2 variables using ezsurf. For example, here's plot the graph of
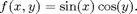
syms x y
f = sin(x)*cos(y)
ezsurf(f)
f =

cos(y)*sin(x)
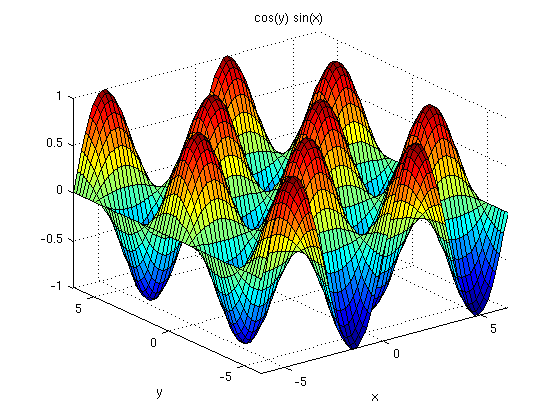
If you want to specify the ranges of values of x and y instead of letting MaTLAB choose, you can. Here x goes from -10 to 10 and y goes from -3 to 3. (For this particular function, it's actually better to use the same range for x and y.)
ezsurf(f,[-10,10,-3,3])
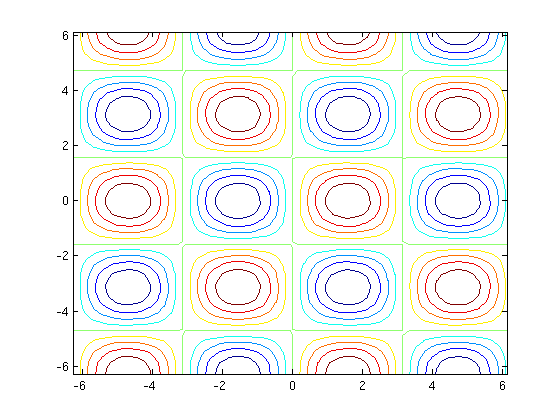
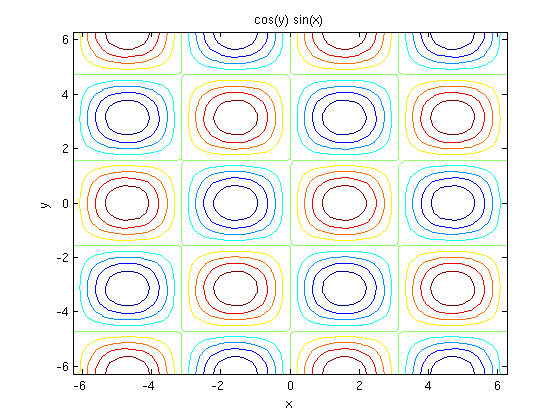
You can use ezcontour to get a contour or level curve plot.
ezcontour(f)
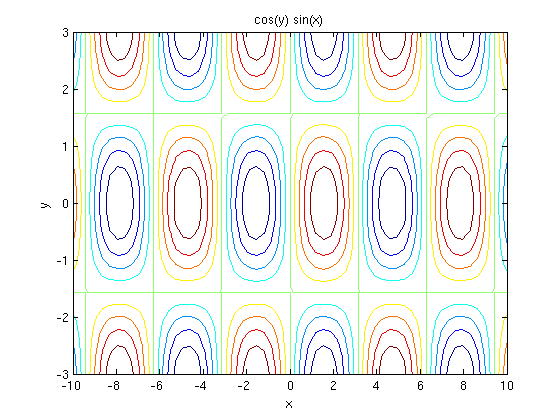
or if you want to specify the ranges of values for x and y
ezcontour(f,[-10,10,-3,3])
A more complicated way
This is useful if you want more control over the plots or don't have access to the syms command
First, define the coordinate grid. Be sure to put the ; at the end of the command. Otherwise MATLAB will print the list of all of the x and y values for points in the grid.
[X1,Y1] = meshgrid(-2*pi:0.2:2*pi,-2*pi:0.2:2*pi);
Now define the function. Remember you have to use .* for multiplication because you are working with vectors.
Z1 = sin(X1).*cos(Y1);
surf(X1,Y1,Z1)
contour(X1,Y1,Z1)