Graphs of a hyperbolic cylinder
Contents
Here are two ways to graph the hyperbolic cylinder

in three dimensional space. Because the cylinder has two pieces, I need two graphs, one for each piece, displayed together.
The grid
I start by creating the grid of points for plotting.
u=linspace(-2,2,50); v=linspace(-2,2,50);
[U,V]=meshgrid(u,v);
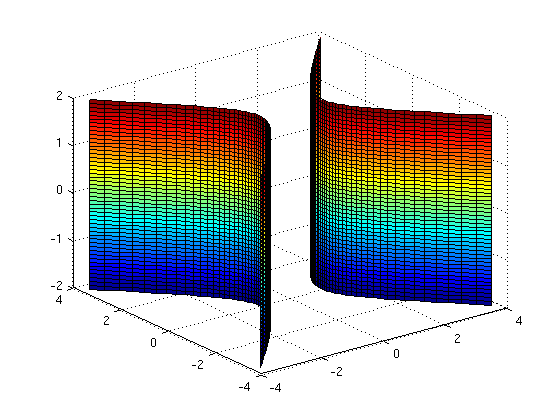
Using mesh
mesh(cosh(U),sinh(U),V), hold on
mesh(-cosh(U),sinh(U),V), hold off
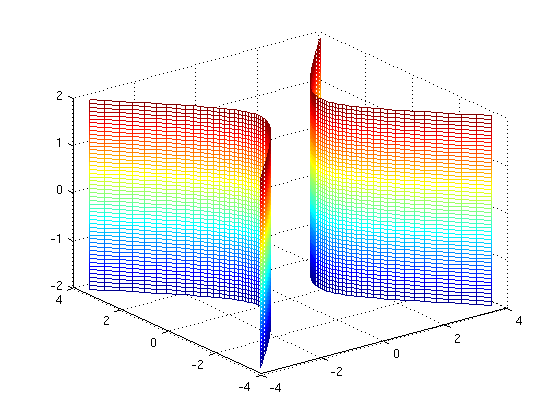
Using surf
surf(cosh(U),sinh(U),V), hold on
surf(-cosh(U),sinh(U),V), hold off