Maxima and Minima of functions of 2 variables
Contents
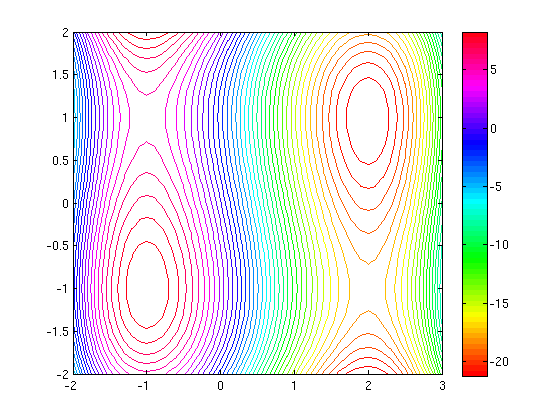
A familiar graph
syms x y
f = 8*exp(-x^2-y^2)*(0.1+x*(y-0.5));
ezsurf(f)
axis([-2 2 -2 2 -2 2]);
view([-23.5 18]);
axis off
title ''
colormap('hsv')
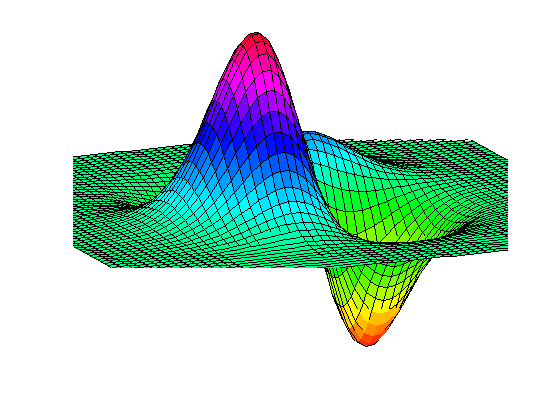
Graph to show max, min and saddle points of f=2x^3+y^3-3x^2-12x-3y
syms x y
f = 2*x^3+y^3-3*x^2-12*x-3*y
ezsurf(f,[-2,3,-2,2])
view([15,60])
colorbar
f =

2*x^3 - 3*x^2 - 12*x + y^3 - 3*y
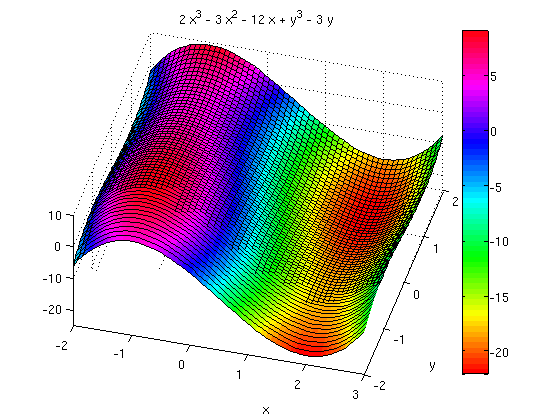
Contour map
ffun = inline(vectorize(f));
[xx, yy] = meshgrid(-2:.1:3,-2:.1:2);
contour(xx, yy, ffun(xx, yy), 40)
colorbar