The Twisted Cubic
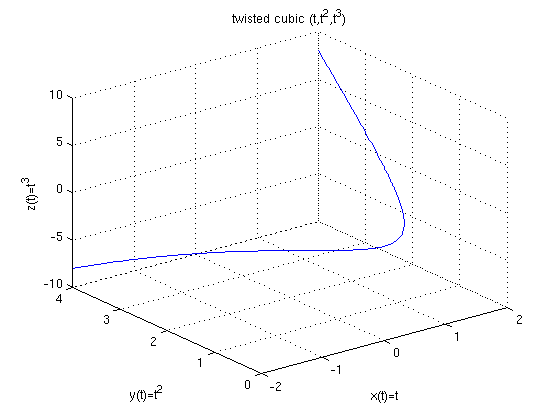
Here are two methods to plot the twisted cubic, the parametric space curve

where the parameter t goes from -2 to 2.
- Using plot3
The first method uses the plot3 command, which is the 3 dimensional analogue of plot. The command linspace(a,b,n) generates a vector with n equally spaced points between a and b, including a and b. (The command linspace(a,b) is the same as linspace(a,b,100).)
t=linspace(-2,2,500);
x=t; y=t.^2; z=t.^3;
plot3(x,y,z), grid
xlabel('x(t)=t')
ylabel('y(t)=t^2')
zlabel('z(t)=t^3')
title('twisted cubic (t,t^2,t^3)')

- Using ezplot3
The second method uses the ezplot3 command, which is the 3 dimensional analogue of ezplot.
syms t
ezplot3(t,t^2,t^3,[-2,2])
xlabel('x(t)=t')
ylabel('y(t)=t^2')
zlabel('z(t)=t^3')
title('twisted cubic (t,t^2,t^3)')
- Using plot tools
In the Tools menu for the plot, you can find Rotate 3D. If you click on this you will be able to rotate the plot to see other views of it. You can also click on the rotate button (just to the right of the hand) on the toolbar of the plot to be able to rotate it.