Using ode45 to solve a system of three equations
Contents
The system
Consider the nonlinear system
dsolve can't solve this system. I need to use ode45 so I have to specify an initial value
Solution using ode45.
This is the three dimensional analogue of Section 14.3.3 in Differential Equations with MATLAB. Think of  as the coordinates of a vector x. In MATLAB its coordinates are x(1),x(2),x(3) so I can write the right side of the system as a MATLAB function
f = @(t,x) [-x(1)+3*x(3);-x(2)+2*x(3);x(1)^2-2*x(3)];
The numerical solution on the interval ![$[0,1.5]$](dim3system_eq00422274475315926941.png) with
with  is
is
[t,xa] = ode45(f,[0 1.5],[0 1/2 3]);
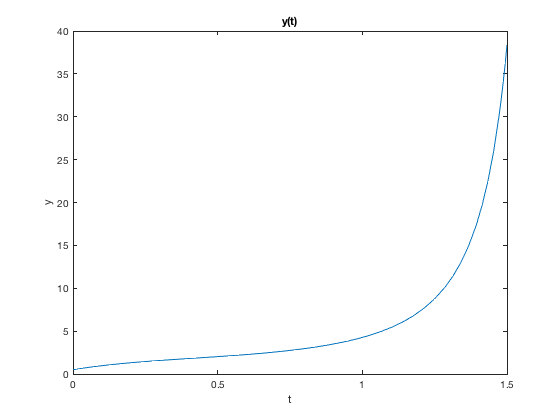
Plotting components
I can plot the components using plot. For example, to plot the graph of  I give the command:
plot(t,xa(:,2))
title('y(t)')
xlabel('t'), ylabel('y')
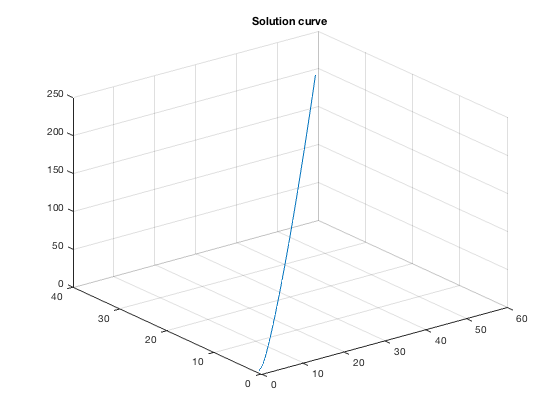
3 D plot
I can plot the solution curve  in phase space using plot3.
plot3(xa(:,1),xa(:,2),xa(:,3))
grid on
title('Solution curve')
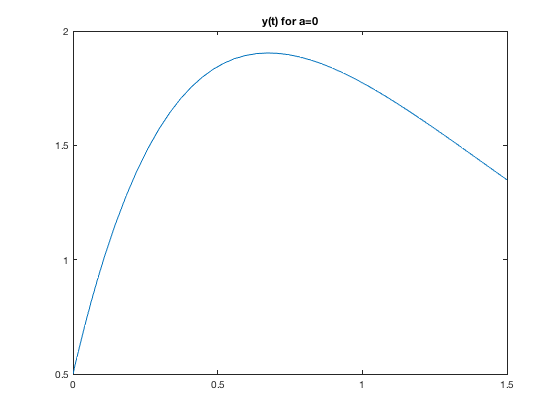
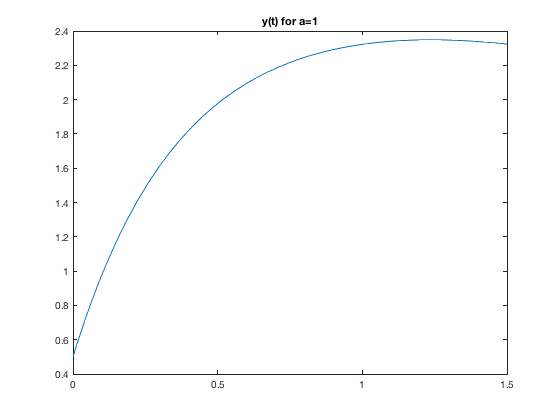
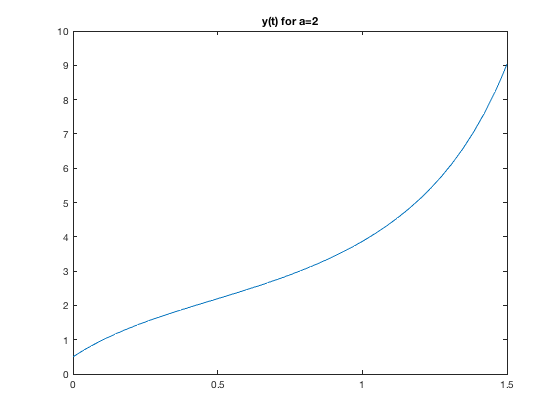
Using ode45 on a system with a parameter.
Suppose I change the system to
and I would like to use a loop to solve and plot the solution for  .
.
syms t x a
g = @(t,x,a)[-x(1)+a*x(3);-x(2)+2*x(3);x(1)^2-2*x(3)]
for a = 0:2
[t,xa] = ode45(@(t,x) g(t,x,a),[0 1.5],[1 1/2 3]);
figure
plot(t,xa(:,2))
title(['y(t) for a=',num2str(a)'])
end
g =

  function_handle with value:

    @(t,x,a)[-x(1)+a*x(3);-x(2)+2*x(3);x(1)^2-2*x(3)]