Section 8.1 SIR model
The model is

If we take  , we can use ode45 to solve and graph the components. Let
  so the system becomes
  where
where  and
and
f = @(t,x) [-x(1)*x(2);x(1)*x(2)-x(2);x(2)]
f =

    @(t,x)[-x(1)*x(2);x(1)*x(2)-x(2);x(2)]
We solve with  and then plot the components of the solution.
[t,xa]=ode45(f,[0 6], [4 0.1 0]);
 plot(t,xa(:,1))
 hold on
 plot(t,xa(:,2),'k')
 plot(t,xa(:,3),'r')
 hold off
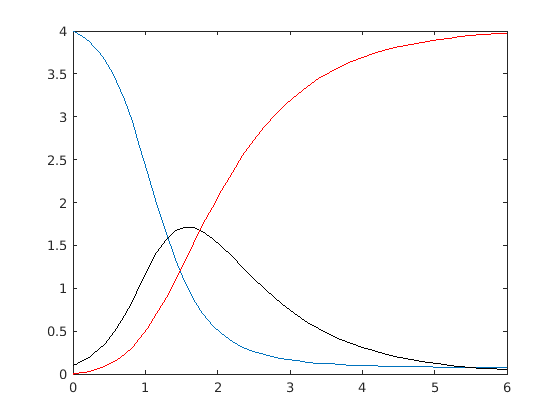
The blue curve is the population which has not yet had the disease, the black curve is the infected population and the red curve is the population which has recovered. We've now reproduced Figure 1 in Polking, Boggess and Arnold.