Plots of the binomial distribution
Contents
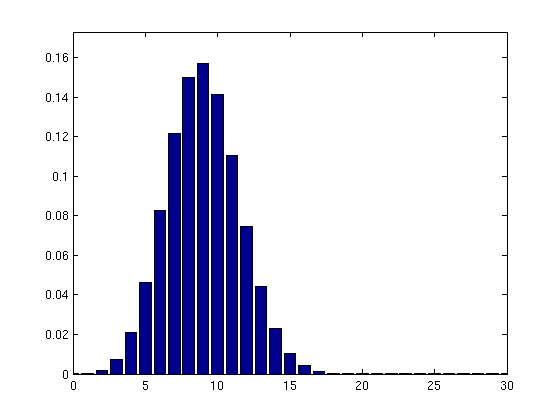
The command binomplot(n,p) will plot a bar graph of the binomial distribution with parameters n and p.
p = 1/2
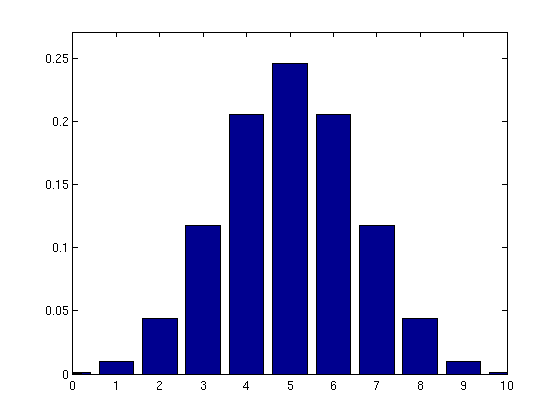
binomplot(10,1/2)
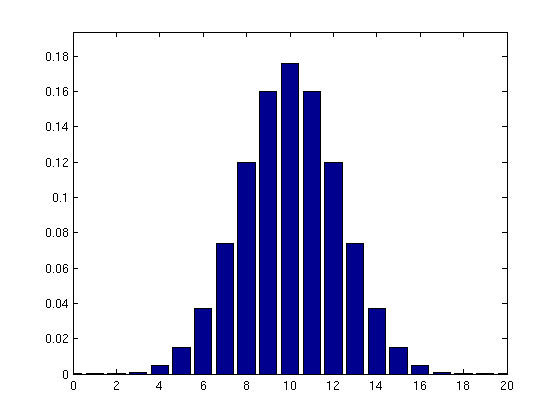
binomplot(20,1/2)
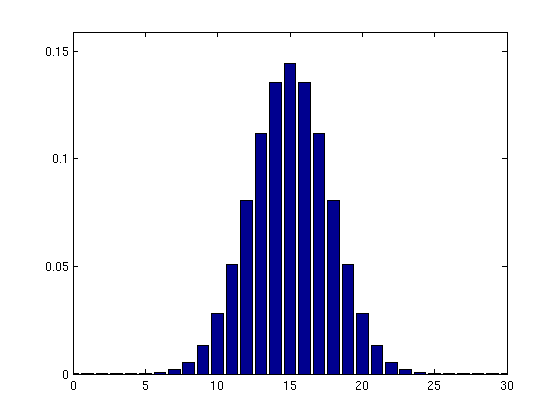
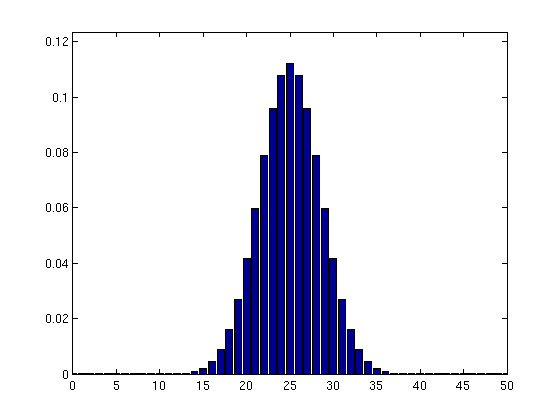
binomplot(30,1/2)
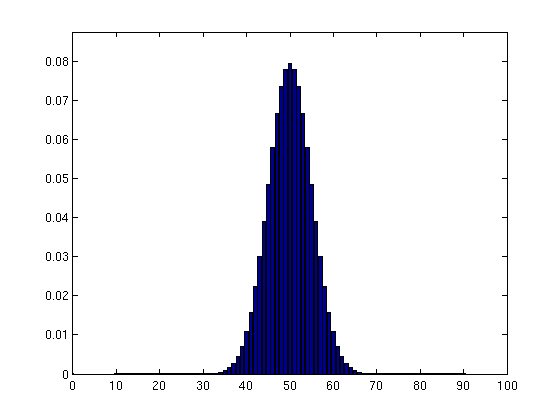
binomplot(50,1/2)
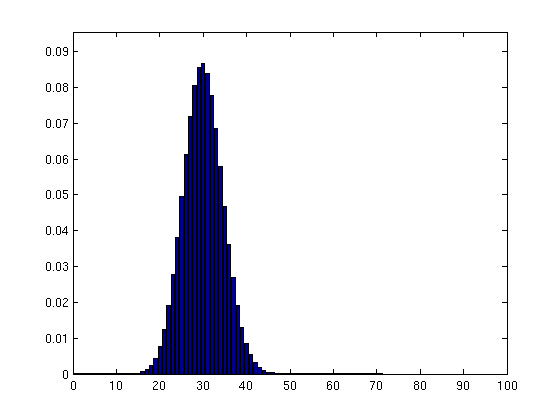
binomplot(100,1/2)
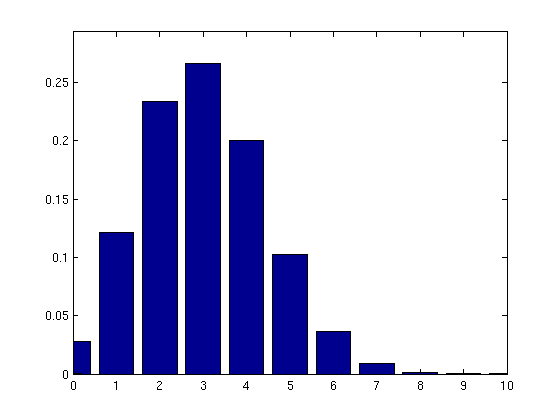
p = .3
binomplot(10,.3)
binomplot(20,.3)
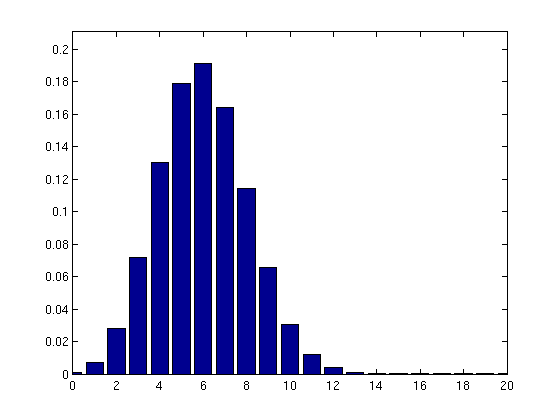
binomplot(30,.3)
binomplot(50,.3)

binomplot(100,.3)