DIFFERENTIAL EQUATIONS WITH MATLAB
CHAPTER 5
An illustration of stability
We look at how the solution to

depends on the initial value c.
syms x
eqn = 'Dy = exp(-x) - 2*y'
Y = dsolve(eqn, 'y(0) = c', 'x')
eqn =

Dy = exp(-x) - 2*y


Y =

1/exp(x) + (c - 1)/exp(2*x)
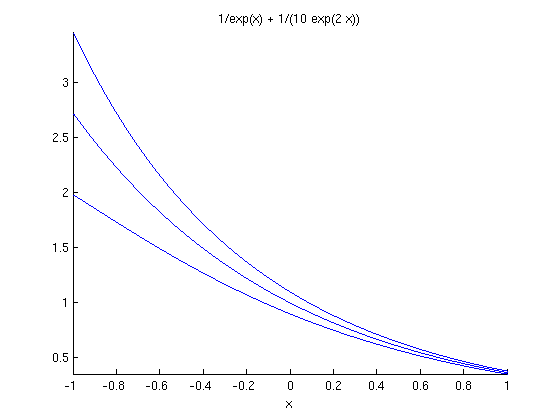
We plot the solution for initial values .9, 1 and 1.1.
figure;
hold on
for j = -1:1
    ezplot(subs(Y,'c',1 + j/10),[-1,1])
end
axis tight
hold off

The inital values are close together. (Two consecutive functions have values which differ by 0.1.) The plots remain close together for positive x, and in fact become closer together. This equation is stable. The derivative of the right side with respect to y is negative.
An illustration of instability
Now we look at the same question for the equation

eqn2 = 'Dy = exp(-x) + 2*y'
Y_2 = dsolve(eqn2,'y(0)=c','x')
eqn2 =

Dy = exp(-x) + 2*y


Y_2 =

exp(2*x)*(c + 1/3) - 1/(3*exp(x))
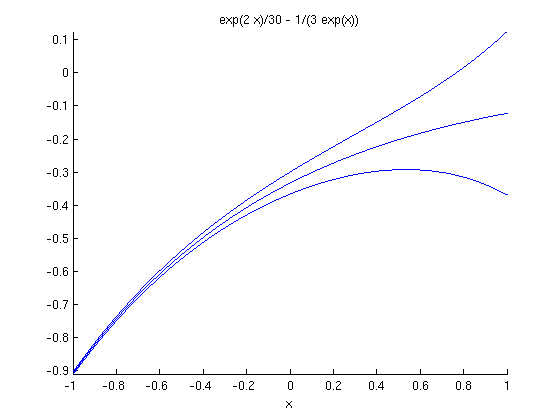
We plot the solution for inital values -11/30, -10/30 and -9/30.
figure;
hold on
for j = -1:1
    ezplot(subs(Y_2,'c',-1/3 + j/30),[-1,1])
end
axis tight
hold off

The functions have initial values at x=0 which are close together. (Two consecutive functions have initial values which differ by 1/30). However, the plots spread apart for positve x. This equation is unstable. The derivative of the right side with respect to y is positive.