Notebook 01: Basic Syntax and Types
Overview
The goal of this assignment is to allow you to explore the basics of the
Python programming language. To record your solutions and answers,
create a new Jupyter Notebook named Notebook01.ipynb and use this
notebook to complete the following activities and answer the corresponding
questions.
Make sure you label your activities appropriately. That is for Activity 1, have a header cell that is titled Activity 1. Likewise, use the Markdown cells to answer the questions (include the questions above the answer).
This Notebook assignment is due midnight Thursday, September 1 and is to be done individually.
Activity 1: Projectile Motion
For the first activity, you are to create a simple calculator that requests the user to enter in an initial velocity and the angle at which a projectile is launched, then compute the time of flight, maximum height reached, and the horizontal range (ie. distance), and finally display a summary of the results.
To do this, you will need to use the following projectile motion formulas:

Here is an example of what the program interaction should look like:
What is the initial velocity? 20
What is the angle (degrees)? 50

Given an initial velocity of 20.0 m/s and an angle of 50.0 degrees:
    The time of flight is 3.13 s
    The maximum height reached is 11.98 m
    The horizontal range is 40.20 m
You are to display the numerical results with only two digits after the decimal point.
Hints
-
Use the raw_input function to prompt and read data from the user.
-
To perform the sin operation, you will need to first import the math library:
import mathOnce this is done, you can then use the math.sin function.
-
Note that the math.sin function requires the input to be in radians, but you require the user to enter in degrees. To convert from degrees to radians, you may use the math.radians function.
-
In Python, you can perform the exponential operation by using
**, such as2**3would be2to the3rdpower. -
In Python, as with written arithmetic, you can group mathematical expressions with parenthesis to ensure order of operations.
-
Use string formatting to format the output text.
Questions
-
Did you use
intsorfloatsto represent your data? Does it make a difference? Why? -
What happens if a user enters in non-numerical input or nothing at all? Why does this happen?
Activity 2: Library Book Shelf
Organizing books in a library is a complex task. Many libraries use the Dewey Decimal Classification system to categorize books and then divide the library into sections that correspond to those labels and numbers. Unfortunately, those identification labels often do not tell patrons which exact shelf a book is on, so it is still up to the patron to search for the row and shelving unit the books is located on.
Suppose, that all the shelves in a library are numbered uniquely and organized in rows as show below.
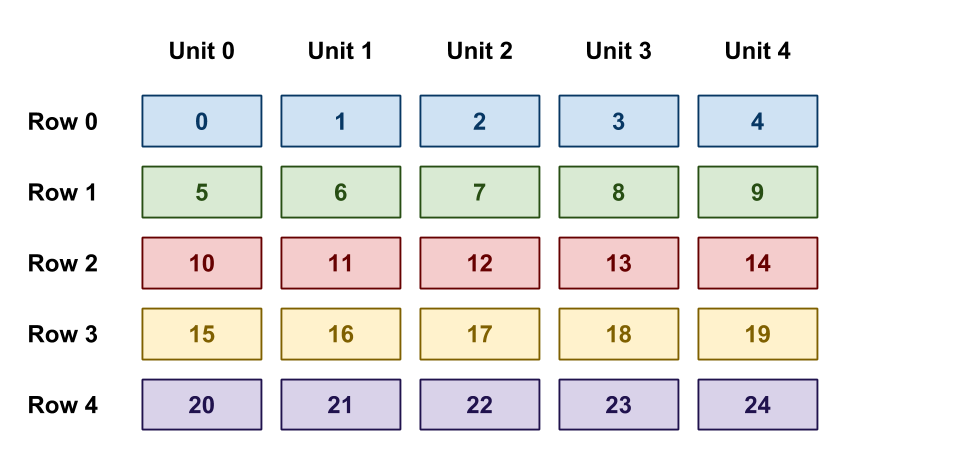
If the library catalog includes information about which shelf number contains a book, it is possible for patrons to determine which row and shelving unit a books is located on based on this number.
For this activity, you are to write a program that asks the user for a shelf number, then displays corresponding shelf unit and row for the given input.
For instance, in the organization above, shelf number 7 is unit 2 in
row 1, while shelf number 16 is unit 1 in row 3.
Here is an example of what the program interaction should look like:
What is the shelf number? 6

Shelf 6 is unit 1 in row 1
Hints
- Use the division and modulus operators to compute the row and unit numbers.
Questions
-
Explain what the modulus operator computes and how you used it in your program.
-
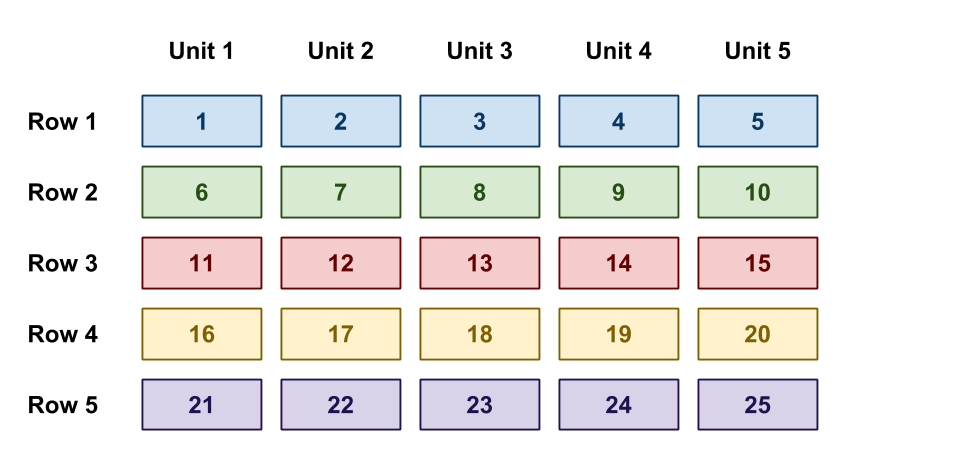
Copy your code into a new cell and then modify it so that it correctly identifies the shelf row and unit given a shelf number in the layout below:
Activity 3: Shapes
For the final activity, you are to create a program that draws a rectangle given user input.
Scalable Vector Graphics
To draw shapes in our Jupyter Notebook, we will need to generate HTML
(Hypertext Markup Language) code, which is what web browsers use to
determine what to display on a web site. For instance, if you right-click
on this page and select View Page Source, you will be shown the HTML
source code for this page:
<!DOCTYPE html>
<html lang="en">
    <head>
      <meta charset="utf-8">
      ...
As you can see, HTML involves the use of tags enclosed by angle brackets <> to denote commands. These tags analogous to keywords in Python. Since HTML is just a series of text, we can actually use another programming language such as Python to generate strings of text that contain HTML!
To draw shapes, we will use a language similar to HTML called SVG (Scalable Vector Graphics) which is dedicated to drawing graphics. Most modern web browsers suc as Chrome or Firefox support SVG along side HTML, so try those browsers if the graphics generated in this lab do not work in your normal web browser.
To create a canvas for our SVG drawings, we need to enclose our shape
commands in a <svg> tag:
<svg height="100" width="100">
  <!-- Shape Commands Go Here //-->
</svg>
To draw a circle, we can use the following SVG code inside the SVG tag:
<circle cx="50" cy="50" r="40" stroke="black" stroke-width="3" fill="red" />
The code above produces the following:
To draw a square, we can use the following SVG code inside the SVG tag:
<rect x="25" y="25" width="50" height="50" stroke="orange" stroke-width="3" fill="blue" />
The code above produces the following:
In a Jupyter Notebook, you can programmatically display HTML code by using the HTML function along with the display function:
from IPython.display import HTML, display

html = '<svg height="100" width="100"><rect x="25" y="25" width="50" height="50" fill="green" /></svg>'
display(HTML(html))
The code above will generate the following:
Note, how we put the SVG code inside a Python string and then
use the display function to show it in the Notebook.
Program
For this activity, you are to ask the user for the x and y coordinate
of a rectangle, its width and height, and finally its color. Once
you have this information, you are to create a string that contains the
appropriate SVG code and then display it.
Here is an example of what the program interaction should look like:
What is the x coordinate? 0
What is the y coordinate? 0
What is the width? 75
What is the height? 75
What is the color? green
Hints
- Use triple quotes to form multi-line strings:
html = '''
<svg height="100" width="100">
  <rect x="25" y="25" width="50" height="50" fill="green" />
</svg>
'''
Questions
-
Explain how you constructed the SVG code and then used it to show the shape.
-
Copy your code into a new cell and then modify it so that it draws a circle instead:
What is the x coordinate? 50
What is the y coordinate? 50
What is the radius? 25
What is the color? blue
Submission
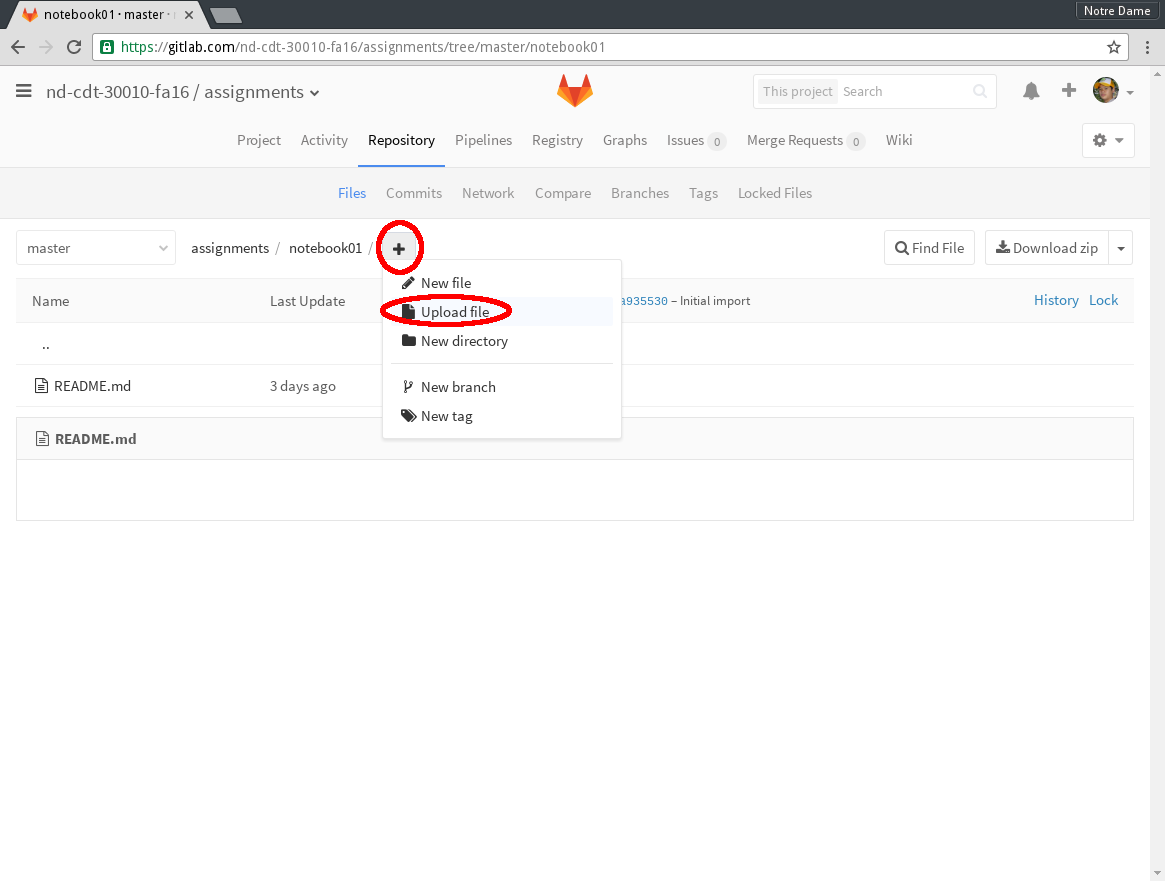
To submit your Notebook, go to your assignments GitLab repository and then click on Files and then notebook01. Next, click on the + sign and select Upload file:
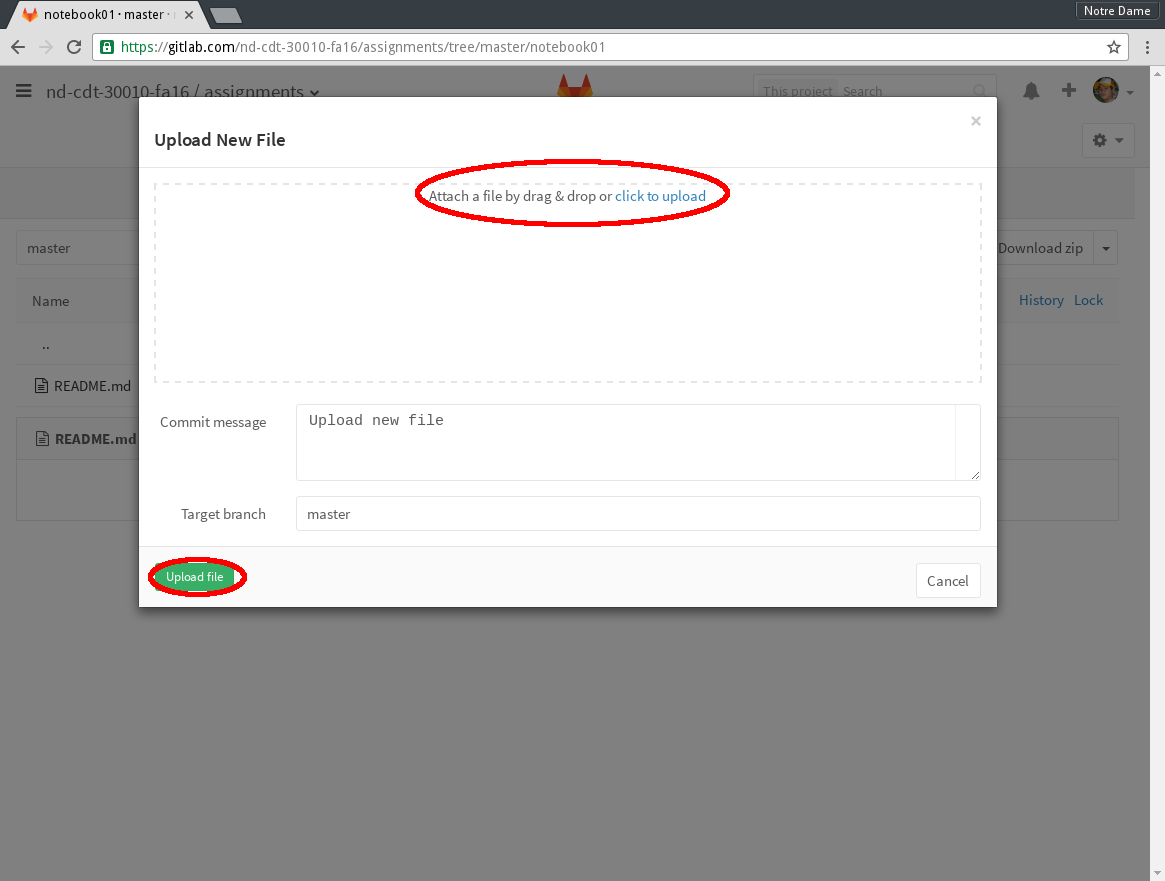
Afterwards, you should attach the Notebook file by dragging and dropping or by using the file dialog. Once it is there, click on the Upload file button.
Once this is done, your Notebook is submitted. If you need to update or modify your submission, simply navigate to the file and then click on the Replace button. This will bring up similar dialog as above, so follow the same procedure.