Lab 01: Functions, RGB Colors
The goal of this lab assignment to allow you to explore boolean logic and binary numbers by writing interactive Python programs that utilize expressions, and functions.
For this assignment, record your work in a Jupyter Notebook and upload it to the form below by 11:59 PM Friday, January 31.
Activity 0: Anaconda + Starter Notebook
To help you get started, we have provided you with a starter notebook, which you can download and then use to record your answers. To utilize the starter notebook, download it to wherever you are running Jupyter Notebook and then use the Jupyter Notebook interface to open the downloaded file.
The starter notebook is already formatted for all the various sections you need to fill out. Just look for the red instructions that indicates were you need to write text or the cyan comments that indicate where you need to write code.
Activity 1: Functions
For the first activity, you are to write a few functions that utilize boolean expressions to test the parameters for certain properties.
Functions
Use the modulo (%) arithmetic operator and less-than-or-equal-to
(<=) comparison operator to implement the following functions:
def is_odd(x):
    ''' Returns whether or not x is odd. '''

def is_even(x):
    ''' Returns whether or not x is even. '''

def is_multiple(x, y):
    ''' Returns whether or not x is a multiple of y. '''

def is_between(x, y, z):
    ''' Returns whether or not y is between x and z (inclusive). '''
Here are some examples of the functions in action:
>>> is_odd(3)
True

>>> is_odd(4)
False

>>> is_even(3)
False

>>> is_even(4)
True

>>> is_multiple(6, 3)
True

>>> is_multiple(6, 4)
False

>>> is_between(2, 3, 4)
True

>>> is_multiple(2, 4, 3)
False
Hints
-
Each function should include a return statement.
-
Each function can be implemented a single boolean expression.
-
The modulo (
%) arithmetic operator returns the remainder in a division expression:>>> 5 % 3 # 5 goes into 3 once, with a remainder of 2 2 >>> 6 % 3 # 6 goes into 3 twice, with no remainder 0
Interaction
Once you have implemented and tested the functions above, write a
test_numbers function that uses the functions you wrote to display the
results of passing inputs x, y, z to the respective functions:
def test_numbers(x, y, z):
    ''' Print the results of passing x, y, z to is_odd, is_even, is_multiple, is_between '''
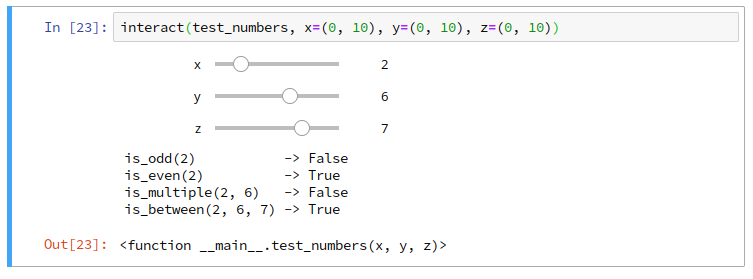
The output of test_numbers(5, 5, 5) should look something like this:
is_odd(5)           -> True
is_even(5)          -> False
is_multiple(5, 5)   -> True
is_between(5, 5, 5) -> True
Once you have a working test_numbers function, use the interact
function to call the test_numbers function repeated based on interactive
inputs:
interact(test_numbers, x=(0, 10), y=(0, 10), z=(0, 10))
The execution of the interact function with the test_numbers function
should produce an interactive widget as shown below:

Expressions
Use your functions above to write boolean expressions that evaluate the following:
-
Whether or not a number is both odd and a multiple of
7? -
Whether or not a number is even but not a multiple of
6? -
Whether or not a number is odd or a multiple of
8? -
Whether or not a number is between
0and100and is even? -
Whether or not a number is odd but not between
20and50, or a multiple of3?
As an example, you can check whether or not a number is both even and a
multiple of 8 with the following expressions:
>>> is_even(16) and is_multiple(16, 8)
True

>>> is_even(12) and is_multiple(12, 8)
False
For each boolean expression provide an example of the expression
evaluating to True and another where it evaluates to False.
Hints
Remember that you can combine boolean expressions with logical and,
or, and not boolean operators.
>>> True and True
True

>>> True and False
False

>>> False or True
True

>>> False or False
False

>>> not False
True

>>> not True
False
Activity 2: RGB Colors
For the second activity, you are to implement a function called
display_color, which given r, g, and b color components, it
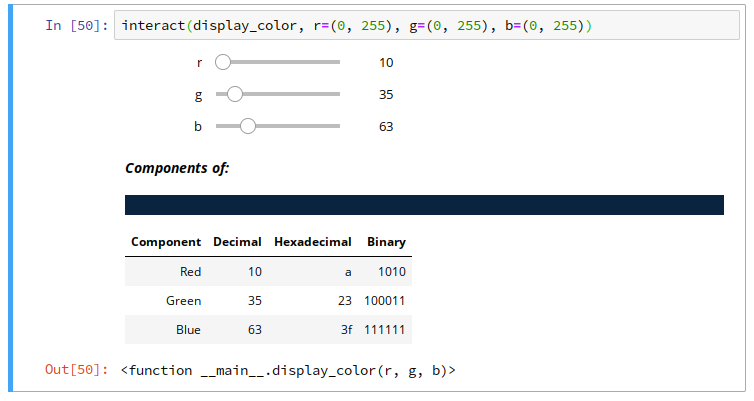
generates a table that shows the following:

That is, for each color component show its decimal, hexadecimal, and binary representation. Likewise, display a color block above the table that shows the color the three components combine to create.
RGB Colors
Recall from Reading 01, that colors can be represented as red, green, and
blue components (RGB color model), where each value represents the
intensity of that color component. Given that each color component is a
single byte (that is 8 bits), the maximum range of values for each
component is 0 - 255. The lower the component value, the less that
component contributes to the overall color. For instance, a RGB of 255,
0, 0 would produce a bright red color since we have maximum red values
and no green and blue.
HTML Table
To display a HTML table in a Jupyter notebook, we can simply embed the
HTML code into a string that we translate and convert using the display
and HTML function. For instance, to show some bolded text, we can do the
following:
text = '<b>Hello, World</b>'
display(HTML(text))
Note, the HTML text is simply a Python string and thus you can do all the things you can normally do on a string such as format.
Since we haven't covered HTML yet (we will later in the semester), we have provided with the necessary HTML template as a string below. You simply need to format it with the appropriate values to make display the results.
TABLE = '''
<h5>Components of:</h5>
<br>
<div style="background: #{};"> </div>
<table>
<thead>
<th>Component</th>
<th>Decimal</th>
<th>Hexadecimal</th>
<th>Binary</th>
</thead>
<tbody>
<tr>
<td>Red</td>
<td>{}</td>
<td>{}</td>
<td>{}</td>
</tr>
<tr>
<td>Green</td>
<td>{}</td>
<td>{}</td>
<td>{}</td>
</tr>
<tr>
<td>Blue</td>
<td>{}</td>
<td>{}</td>
<td>{}</td>
</tr>
</tbody>
</table>
'''
Display Color Function
Write a display_color function that given the r, g, and b values of
a color as integers, it outputs an HTML table as described above:
def display_color(r, g, b):
    ''' Display a HTML table that shows the color of the r, g, b
    components and their decimal, hexadecimal, and binary
    representations.
    '''
    color = None # Combine the hexadecimal representation of r, g, b
    table = TABLE.format(
        color,
        r, 0, 1, # Replace 0 with hexadecimal value of r, 1 with binary value of r
        g, 0, 1, # Replace 0 with hexadecimal value of g, 1 with binary value of g
        b, 0, 1, # Replace 0 with hexadecimal value of b, 1 with binary value of b
    )
    display(HTML(table))
Note, you will want to use string formatting to modify the TABLE
template string.
Hints
You can use the format function to convert an integer to different number representations.
>>> format(127, '02x')      # Convert 127 into hexadecimal
7f
Color Interaction
Once you have a working display_color function, use the interact
function repeatedly call display_color on different r, g, b
values:
interact(display_color, r=(0, 255), g=(0, 255), b=(0, 255))
This should produce an interactive widget that looks like this:

Note, the color block and the values in the table should change as you
adjust the r, g, b sliders.
Exploration
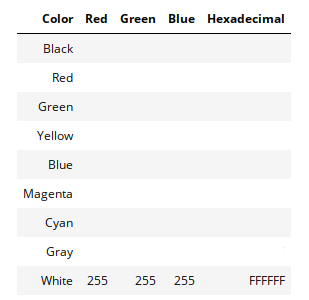
Use your display_color widget to fill in the following table of colors:

Of course, there are many different shades of each color, so use your
display_color widget to find your favorite shade and enter in the RGB
values of each color as decimals, along with the hexadecimal representation
of each color.
Submission
Once you have completed your lab, submit your Jupyter Notebook using the form: