Reading 08: Document Tools
Readings
This week the readings will focus on LaTeX and gnuplot, which are tools for programmatically generating documents.
The readings for Monday, March 14 are:
-
A simple guide to LaTeX - Step by Step
You only have to read the Beginners portion. Note, that some of the code from this website may contain errors. For more accurate code examples please see the sample latex file.
-
A collection of Gnuplot examples
This is a decent blog post on the basics of gnuplot.
Optional Resources
-
Notre Dame has a site license for this website which is a great tool for interactive and collaborate LaTeX document creation. The website also provides great documentation:
Questions
Shell Scripts
In your reading08 folder, write the following shell scripts:
-
roll_dice.sh:$ ./roll_dice.sh -h usage: roll_dice.sh [-r ROLLS -s sides] -r ROLLS Number of rolls of die (default: 10) -s SIDES Number of sides on die (default: 6)This script simulates random dice rolls using the shuf command:
$ ./roll_dice.sh 1 2 6 2 4 1 1 1 3 6 $ ./roll_dice.sh -r 4 6 4 1 3 -
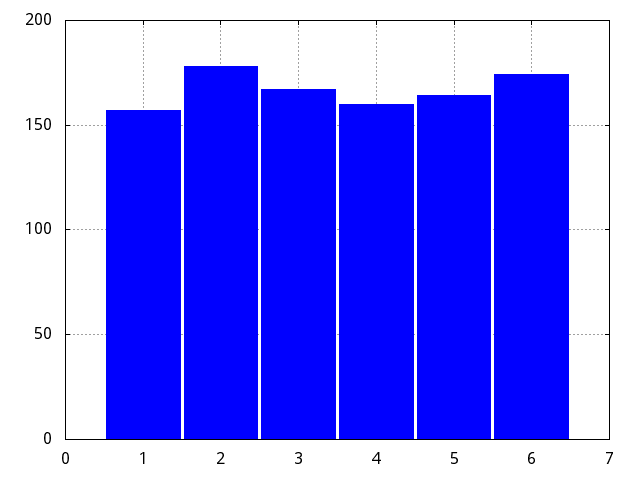
experiment.sh:This script uses the
roll_dice.shscript to simulate1000dice rolls and then uses awk to aggregate the output of dice rolls to produce a tsv output (ie.results.dat) that looks like the following (exact values will be different):1 157 2 178 3 167 4 160 5 164 6 174
GNU Plot
Once you have these two shell scripts, write the following gnuplot script:
-
histogram.pltThis is a gnuplot script that uses the data from
results.datto produce a histogram (ie.with boxes) calledresults.png.
LaTeX Report
Once you have these scripts, you are to create a LaTeX report that looks like the following PDF and contains the following:
-
An Overview section describing what you did.
-
A Rolling Dice section describing what you did for the first script.
-
A Experiment section describing what you did for the second script.
-
A Results section that shows the results of your experiment. This section should include a table and a plot generated using gnuplot.
To help you, here is a sample latex file and the resulting sample pdf.
Makefile
Finally, you should include a Makefile that will automatically build the
results.png and reading08.pdf by simply typing in make. The Makefile
should look something like this:
all:    reading08.pdf

reading08.pdf:  ...
        ...

results.png:    ...
        ...

clean:
      rm -f reading08.pdf results.png
To compile the LaTeX document, you should use pdflatex. Note, you may need to run the command twice to ensure the references are correct.
Feedback
If you have any questions, comments, or concerns regarding the course, please provide your feedback at the end of your response.
Submission
To summarize, you should commit the following files:
-
Makefile -
roll_dice.sh -
experiment.sh -
histogram.plt -
reading08.tex
To submit your assignment, please commit your work to the reading08 folder
in your Assignments Bitbucket repository by the beginning of class
on Monday, March 14.