Homework 04: Visualizing Data
The goal of this homework assignment is to allow you to practice using Python and Jupyter to visualize data. In this assignment, you will download data in both JSON and CSV format, process it, and then present it visually using HTML or matplotlib.
For this assignment, record your scripts and any responses to the following
activities in the in the homework04 folder of your assignments GitLab
repository and push your work by 11:59 AM Saturday, February 25.
Activity 0: Preparation
Before starting this homework assignment, you should first perform a git
pull to retrieve any changes in your remote GitLab repository:
$ cd path/to/repository                   # Go to assignments repository

$ git checkout master                     # Make sure we are in master branch

$ git pull --rebase                       # Get any remote changes not present locally
Next, create a new branch for this assignment:
$ git checkout -b homework04 # Create homework04 branch and check it out
To start Jupyter, remember from Reading 05 that you can do the following on a student machine:
$ jupyter notebook --ip studentXX.cse.nd.edu --port 9000 --no-browser
Of course, replace studentXX.cse.nd.edu with whatever student machine
you are using. Once this is executed, it will give you a URL that looks
something like this:
Copy/paste this URL into your browser when you connect for the first time,
to login with a token:
    http://student00.cse.nd.edu:9000/?token=0e97be5f0cdf8aeb6512d005e47e329605bc1b2fc9365689
Simply copy and paste that URL into your local web browser. You know can create a notebook and interactively write and execute Python code via your web browser.
You are now ready to work on the activities below.
Activity 1: Multi-Reddit (6 Points)
Katie likes to sit in the back of the class. It has its perks:
-
She can beat the rush out the door when class ends.
-
She can see everyone browsing Facebook, playing video games, watching YouTube, or doing homework.
-
She feels safe from being called upon by the instructor... except when he does that strange thing where he goes around the class and tries to talk to people. Totally weird 1.
That said, sitting in the back has its downsides:
-
She can never see what the instructor is writing because he has terrible handwriting and always writes too small.
-
She is prone to falling asleep because the instructor is really boring and the class is not as interesting as Data Structures is this semester.
To combat her boredom, Katie typically just browses Reddit. Her favorite subreddits are AdviceAnimals, aww, todayilearned, and of course UnixPorn. Katie is tired of having to go to each subreddit and browsing for cool links, however, and decides she wants to create a little app inside of a Jupyter notebook that allows her to aggregate links from multiple subreddits 2.
Fortunately for Katie, Reddit provides a JSON feed for every subreddit.
You simply need to append .json to the end of each subreddit. For
instance, the JSON feed for todayilearned can be found here:
https://www.reddit.com/r/todayilearned/.json
To fetch that data, Katie uses the [Requests] package in Python to access the JSON data:
import requests

r = requests.get('https://www.reddit.com/r/todayilearned/.json')
print(r.json())
429 Too Many Requests
Reddit tries to prevent bots from accessing its website too often. To work
around any 429: Too Many Requests errors, we can trick Reddit by
specifying our own user agent:
import os

headers  = {'user-agent': 'reddit-{}'.format(os.environ['USER'])}
response = requests.get('https://www.reddit.com/r/linux/.json', headers=headers)
This should allow you to make requests without getting the dreaded 429 error.
This script would output something like the following:
{"kind": "Listing", "data": {"modhash": "g8n3uwtdj363d5abd2cbdf61ed1aef6e2825c29dae8c9fa113", "children": [{"kind": "t3", "data": ...
Looking through that stream of text, Katie sees that the JSON data is a collection of structured or hierarchical dictionaries and lists. This looks a bit complex to her, so she wants you to help her complete the Jupyter notebook which fetches the JSON data for multiple subreddits and allows the user to sort the articles by various fields and restrict the number of items displayed.
Code
For this activity, create a Activity 01 Jupyter notebook (ie. Activity
01.ipynb) in your homework04 directory that contains the function:
# Imports

import requests

from IPython.display import HTML
from ipywidgets import interact

# Functions

def multireddit(subreddits, limit=5, orderby='score'):
    ''' Displays an HTML listing of the top `limit` articles from the
    various `subreddits` specified by the user.  These articles will be
    sorted by the field specified by `orderby`

      - `subreddits` is a comma-separated list of subreddits (ie.
        `linux,linuxmasterrace`)

      - `orderby` is any field in the Reddit JSON data for a particular
        article (ie. `score`, `title`, `created_utc`, etc.)
    '''

    # TODO: Process function arguments

    # TODO: Fetch subreddit data

    # TODO: Sort and limit data, and construct HTML results
    html = ''
    ...

    display(HTML(html))
This function takes a list of subreddits such as linux,linuxmasterrace,
fetches the JSON data corresponding to each subreddit, combines the
articles, sorts them by the orderby field, and then outputs up to limit
articles in HTML as shown below:
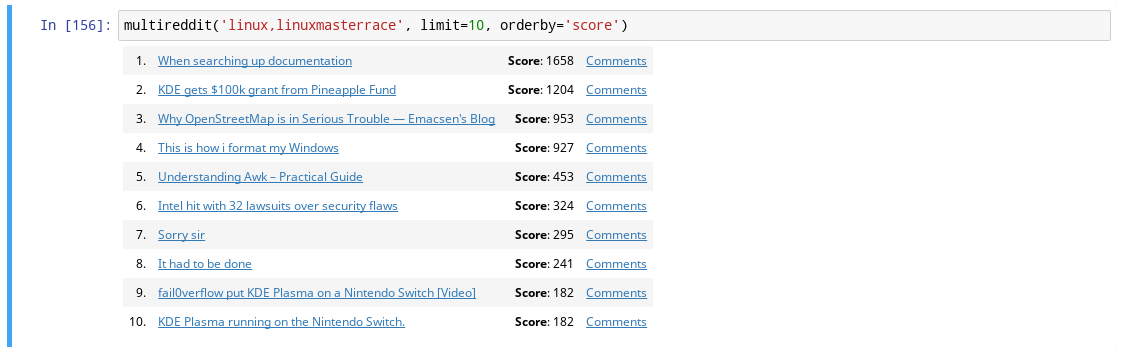
Note: Your code must display HTML that includes the article number, the article title that links to the original URL, the article score, and the link to the comments for the article. It does not need to exactly match the example above, but it should contain the same elements. Feel free to stylize the HTML anyway you want.
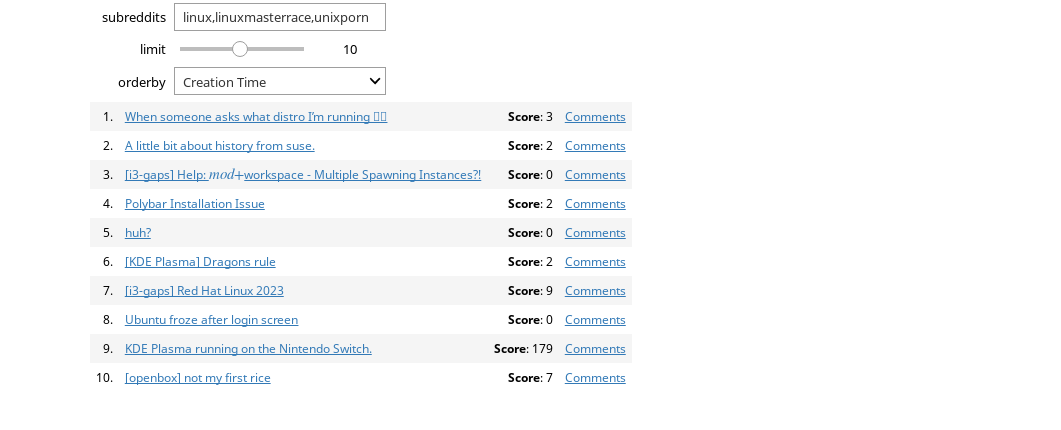
Once you have a working multireddit function, you can use the interact
function to create an interactive app:
ORDERBY = {
    'Score': 'score',
    'Creation Time': 'created_utc',
    'Title': 'title'
}

interact(multireddit, subreddits='', limit=(1, 20), orderby=ORDERBY)
This creates an interactive app that looks like this:
Responsiveness
Because we are making live requests to real website, the response might not be as quick as you would hope. Be patient and realize you are fetching live data from a website used by millions of users everyday.
Hints
-
To fetch the JSON data, you should use the requests.get function on the appropriate
SUBREDDITURL. You may need to perform requests.get in a loop (say up to20) times to get around Reddit's anti-bot protection mechanism. Simply, check that thestatus_codeof the response is200to verify that you have valid data before exiting this loop. You may wish to create a separate function,fetch_subreddit, to handle this for you. -
To extract the articles from the subreddit, you will need to iterate through the appropriate JSON data structures you get from requests.get corresponding to the articles.
-
To display the results, you should construct a single large string by iterating over the sorted articles and then concatenting to an
htmlvariable the HTML code you wish to display. When the loop is complete, you can simply calldisplay(HTML(html))to display the HTML code you constructed. To make the results look nice, you should consider using an ordered list or table element.Here is example of what an ordered list might look like:
<ol>
  <li><a href="https://www3.nd.edu/~rbualuan/">Ramzi</a></li>
  <li><a href="https://www3.nd.edu/~skumar5/">Shreya</a></li>
  <li><a href="https://www3.nd.edu/~pbui/">Bui</a></li>
</ol>
This creates an ordered list where each list item contains a link in the form of an anchor element. This HTML code would produce something like this:
Here is an example of what a table might look like:
<table>
  <tbody>
    <tr>
      <td>1.</td>
      <td><a href="https://www3.nd.edu/~rbualuan/">Ramzi</a></td>
    </tr>
    <tr>
      <td>2.</td>
      <td><a href="https://www3.nd.edu/~skumar5/">Shreya</a></td>
    </tr>
    <tr>
      <td>3.</td>
      <td><a href="https://www3.nd.edu/~pbui/">Bui</a></td>
    </tr>
  </tbody>
</table>
This creates a table with three rows with two cells: an index and another containing a link in the form of an anchor element as shown below:
1. Ramzi 2. Shreya 3. Bui Your
multiredditfunction should programmatically generate HTML code similar to that shown above and then display it usingdisplay(HTML(html))wherehtmlis a large string containing the HTML code.
Iterative and incremental development
Do not try to implement everything at once. Instead, approach this activity with the iterative and incremental development mindset and slowly build pieces of your application one feature at a time:
-
Parse the function arguments.
-
Fetch the data for one subreddit.
-
Fetch the data for all subreddits.
-
Combine and sort the data.
-
Print only a subset of the sorted data.
-
Construct and display the HTML of the results.
Remember that the goal at the end of each iteration is that you have a working program that successfully implements all of the features up to that point.
Focus on one thing at a time and feel free to write small test code to try things out.
Questions
At the end of your Activity 01 notebook, describe how you implemented the
the multireddit function. In particular, briefly discuss:
-
How you parsed and utilized the arguments to the
multiredditfunction. -
How you fetched the JSON data and iterated over the articles to extract the relevant data.
-
How you constructed and formatted the HTML output for the relevant articles.
Note: Be sure to use Markdown syntax to properly format your Jupyter notebook.
Activity 2: CSE Demographics (4 Points)
One of the most pressing questions in Computer Science Education is addressing the lack of diversity in computing. In order to meanfully examine this issue, we will first need to look at some raw data. For this activity, you are to download, process, and visualize the Computer Science and Engineering demographic data from the classes of 2013 through 2020 and then answer some reflection questions.
Background
For context and background material, you may wish to first read some of the following articles regarding gender and ethnic diversity in Computer Science and the technology industry in general:
-
Google finally discloses its diversity record, and it's not good
-
Push for Gender Equality in Tech? Some Men Say It’s Gone Too Far
Ethical and Professional Issues
This assignment is inspired by a discussion we have in the CSE 40175 Ethical and Professional Issues class, which is a required course for all Computer Science and Engineering students.
Demographic Data
Our beloved Ramzi has graciously provided us with the student demographic data for all Computer Science and Engineering students from the class of 2013 through 2020. This data looks something like this:
2013,,2014,,2015,,2016,,2017,,2018,,2019,,2020,
M,C,M,C,F,N,F,N,M,C,M,C,F,T,M,C
M,C,M,S,M,C,M,C,M,N,M,C,F,O,F,C
M,C,M,C,M,C,F,C,F,N,M,C,M,C,M,C
M,C,M,C,M,C,M,N,M,C,M,C,F,C,M,C
M,C,M,C,M,C,F,C,M,C,F,O,M,C,M,C
F,C,M,C,M,C,F,N,F,C,M,C,F,C,M,C
M,C,M,C,M,C,F,C,M,C,M,C,F,N,F,C
M,C,M,C,M,O,F,C,M,C,M,C,M,C,M,C
M,O,M,C,F,O,M,C,M,C,M,C,M,C,M,C
M,C,M,C,M,C,M,N,M,C,M,C,M,O,F,C
...
As can be seen above, the demographics.csv file has two columns for each class:
-
The first column records the gender and contains either
MorFwhich stands forMaleorFemalerespectively. -
The second column records the ethnicity and consists of the following mapping:
Letter Ethnicity C Caucasian O Asian S Hispanic B African American N Native American / Pacific Islanders T Multiple Selection U Undeclared
Code
For this activity, create a Activity 02 Jupyter notebook (ie. Activity
02.ipynb) in your homework04 directory. Use this notebook to create a
report with graphs that summarize this demographic data described above.
To view any graphs you generate inside the Jupyter notebook, include the following command in one of your Jupyter cells:
%matplotlib inline
To process and extract the demographic data, you can use the following workflow:
# Imports

import collections
import requests

# TODO: Fetch demographic data

# TODO: Extract years from header line (ie. first line)

# TODO: Extract data corresponding to each year (ie. remaining lines)
At the end of your processing, you should have a dictionary in the following general format:
{ year: { category: count, ... }, ... }
That is you should have a dictionary where each item is a mapping from a year to another dictionary value where each item is a category and a count corresponding to the number of students in that category.
For instance, in the class of 2013, there were 49 males and 14 females, while the class of 2014 had 44 males and 12 females. The resulting dictionary that contains this data should look something like this:
{
    2013: { 'M': 49, 'F': 14 },
    2014: { 'M': 44, 'F': 12 },
}
After you have processed the data and put it in a dictionary as show above, you can then plot the data using matplotlib. For instance, to create stacked bar graph you can use the following function:
import matplotlib.pyplot as plt

def plot_gender_pct(data):
    fig, ax = plt.subplots(1,1,figsize=(10, 8))
    years   = sorted(data.keys())
    males   = []
    females = []
    for year in years:
        m = data[year]['M']
        f = data[year]['F']
        t = m + f
        males.append(m * 100.0 / t)
        females.append(f * 100.0 / t)

    ax.bar(years, females, color='r', label='Female')
    ax.bar(years, males, bottom=females, color='b', label='Male')

    plt.legend(bbox_to_anchor=(1.04,1), loc="upper left")
    plt.show()
Once you have code that can process the data and generate graphs, you are to write a report inside the notebook that answers the following two questions:
-
What is the overall trend in gender balance in the Computer Science and Engineering program at the University of Notre Dame?
For this question, you can use the
plot_gender_pctfunction above to create a graph that looks like this: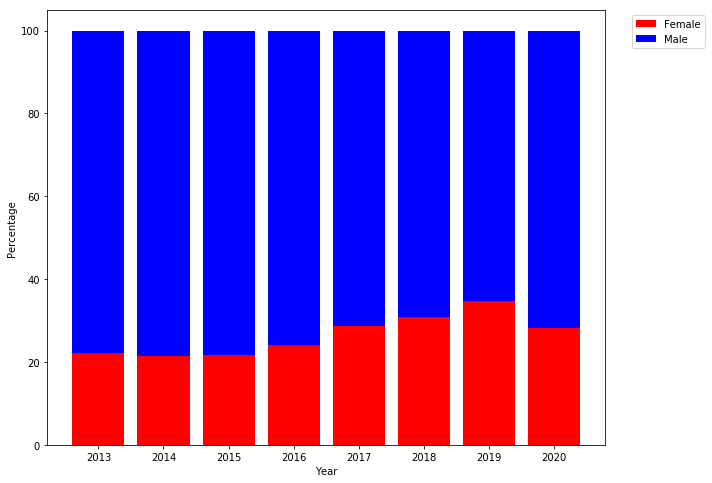
-
How has ethnic diversity changed over time in the Computer Science and Engineering program at the University of Notre Dame?
For this question, you should create a
plot_ethnicity_pctfunction similar to theplot_gender_pctfunction to create a stackplot that looks like this: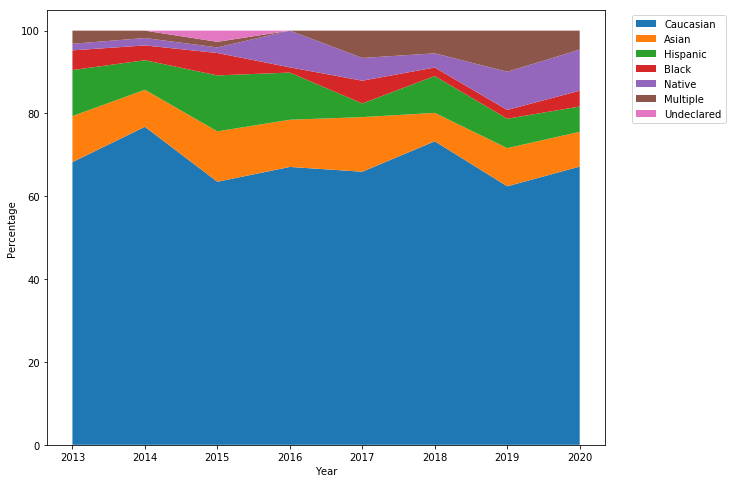
Hints
-
Use the Jupyter notebook to explore the data iteratively. You can always remove unused cells or edit things later.
-
To fetch the demographic data, you can use the requests.get method. You can then access the raw data via the
textproperty of the object returned by requests.get. -
The first line of the demographic data is a header that includes the years you need to graph. The remaining lines of the demographic data are pairs of gender, ethnicity as described above.
-
You can use the str.split to convert each row of data into a list of values.
-
You can use collections.defaultdict to create a dictionary with a default type. This is useful for accumulating a count.
Questions
Finally, once you have the two diagrams above, you are to organize your
Activity 02 notebook into the following sections:
-
Overview: This provides a brief overview (a paragraph) of what you did, how you did it, what you discovered, and what your main takeaway was.
-
Methodology: This is where the code you used to process and graph the data goes, along with a brief description of how you accomplished these tasks.
-
Analysis: This should include the actual graphs you generated as well as some commentary on the meaning of the data and plots.
-
Discussion: This final section is an opportunity for you to reflect on the issue of creating a welcoming and supportive learning environment at the University of Notre Dame. For instance, you may wish to discuss any of the following questions:
-
Are the issues of gender and ethnic diversity important to you? Should the department work to increase diversity? Should the technology industry try to improve workplace diversity? Why or why not?
-
Does the Computer Science and Engineering department provide a welcoming and supportive learning environment to all students? In what ways can it improve?
-
What challenges have you experienced thus far in the [Computer Science and Engineering] program? How could the department or university better support you?
-
Guru Point (1 Point)
For extra credit, you are to explore an online dataset (preferably in CSV or JSON format) and visualize it a Jupyter notebook using matplotlib, wordcloud, plotly, or any other Python package you wish to explore. Here are some sources for datasets:
-
data.gov: A large repository of information collected from federal and state governments. From this repository, you will find all sorts of information, including those that will allow you to answer the questions:
-
What colleges or universities perform well in the College Scorecard? How does Notre Dame compare to its aspirational peers?
-
What post secondary instituations are in your hometown or state? How many schools have the word College in their name rather than University?
-
What years have seen the most submissions of Constitutional Amendments? Who has submitted the most? From which state?
-
And much more!
-
-
r/datasets: A subreddit dedicated to interesting data sources. For instance, people have recently submitted the following datasets:
-
FiveThirtyEight: A collection of data and code used to power some of [FiveThirtyEight]'s articles, including:
Once you find an interesting dataset, come up with an interesting question, and then write some code and generate a plot or chart that helps you answer it.
To get credit, you must show either a TA or the instructor a demonstration of your Jupyter notebook with the code and visualization.
Feedback
If you have any questions, comments, or concerns regarding the course, please
provide your feedback at the end of your README.md.
Submission
To submit your assignment, please commit your work to the homework04 folder
of your homework04 branch in your assignments GitLab repository:
#--------------------------------------------------
# BE SURE TO DO THE PREPARATION STEPS IN ACTIVITY 0
#--------------------------------------------------

$ cd homework04                           # Go to Homework 04 directory
...
$ git add "Activity 01.ipynb"             # Mark changes for commit
$ git commit -m "homework04: activity 1"  # Record changes
...
$ git add "Activity 02.ipynb"             # Mark changes for commit
$ git commit -m "homework04: activity 2"  # Record changes
...
$ git push -u origin homework04           # Push branch to GitLab
Pipeline Failure
There are no automated tests for this assignment, so the GitLab pipeline will fail.
Remember to create a merge request and assign the appropriate TA from the Reading 05 TA List.