THE STUDY OF THE FRESHMAN 15 PHENOMENON
What is the Freshman 15?
"The term “freshman 15” is commonly used in America to describe the weight students tend to gain during their freshman year in college, which is believed to be around 15 pounds (7 kg)."
Is the Freshman 15 real?
What is the Freshman 15?
"The term “freshman 15” is commonly used in America to describe the weight students tend to gain during their freshman year in college, which is believed to be around 15 pounds (7 kg)."
Is the Freshman 15 real?
According to Healthline, in a review of 32 studies, researchers discovered that more than 60% of college students gained at least 7.5 pounds (3.5 kg) during their freshman year of college. Our data shows similar results, with the 67 college freshmen in the study gaining an average of 1.179kg from September to April. I believe that this is enough proof to show that the phenomenon of the Freshman 15 is, in fact, real. (https://www.healthline.com/nutrition/freshman-15#what-causes-it)
Graphs That We Made From CSV File
Insights that can be drawn from graphs:
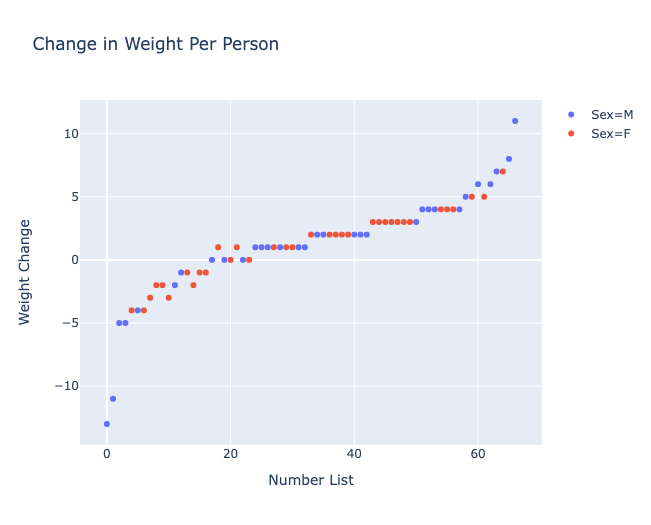
1. The majority of people gained weight over the course of their freshman year in college from September to April (Change in Weight per Person)
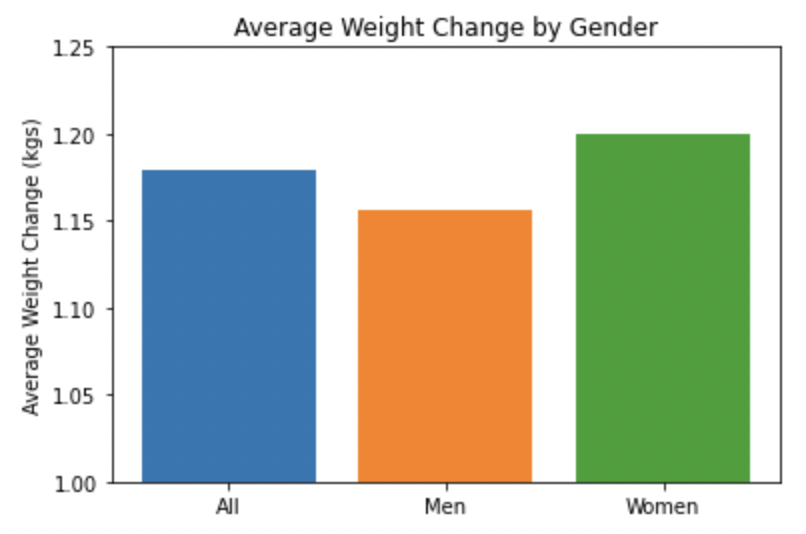
2. The average participant in the study (independent of gender) gained 1.179 kgs from September to April. (Average Weight Change by Gender)
3. The average man in the study gained 1.16 kgs while the average woman gained 1.2 kgs. (Average Weight Change by Gender)
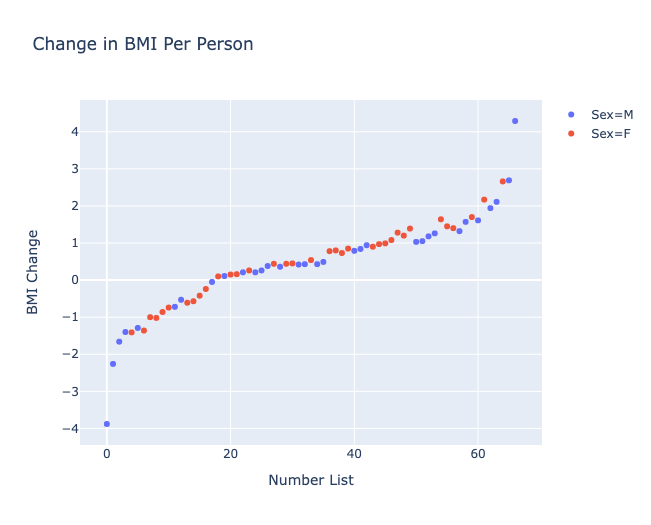
4. The change in BMI and weight of the participants was almost perfectly positively correlated. (Change in BMI Per Person, Change in Weight Per Person)
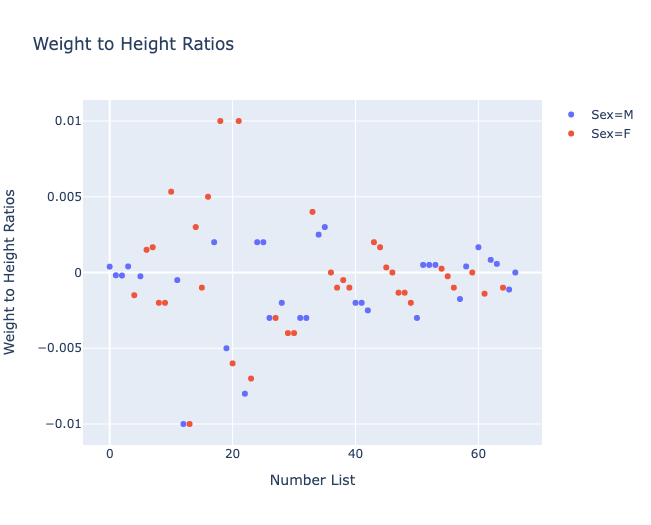
5. Since there is no correlation between height and weight, the weight increase was due to a factor other than a height height increase. (Weight to Height Ratios)
6. The top 6 most outstanding weight changes were all men, with the largest change being a loss of 13 pounds. (Change in Weight per Person)
Code for the dataframe
      import csv
      import pandas as pd

      fh = open('freshman_kgs.csv')

      freshmankgs_reader = csv.reader(fh)
      height_sept = []
      height_apr = []

      freshmankgs_list =  list(freshmankgs_reader)
      del(freshmankgs_list[0])
      df = pd.DataFrame(freshmankgs_list, columns=['Sex','Weight(Sep)', 'Weight(Apr)', 'BMI(Sep)','BMI(Apr)'])
      df['Height(September)'] = [1.808, 2.219, 1.753, 1.857, 1.778, 1.777, 1.625, 1.624, 1.521, 1.628, 1.684, 1.7, 1.8, 1.634, 1.601, 1.618, 1.649, 1.928, 1.66, 1.808, 1.658, 1.633, 1.742, 1.565, 1.92, 1.748, 1.782, 1.641, 1.827, 1.701, 1.683, 1.742, 1.728, 1.637, 1.901, 1.777, 1.604, 1.625, 1.703, 1.605, 1.689, 1.679, 1.641, 1.696, 1.669, 1.733, 1.68, 1.603, 1.656, 1.58, 1.909, 1.909, 1.807, 1.744, 1.558, 1.674, 1.754, 1.859, 1.756, 1.713, 1.786, 1.594, 1.699, 1.779, 1.669, 1.808, 1.603]
      df['Height(April)'] = [1.803, 2.221, 1.754, 1.855, 1.784, 1.778, 1.619, 1.619, 1.525, 1.632, 1.668, 1.701, 1.81, 1.644, 1.595, 1.619, 1.644, 1.93, 1.67, 1.803, 1.652, 1.643, 1.734, 1.558, 1.922, 1.75, 1.779, 1.638, 1.825, 1.697, 1.679, 1.739, 1.725, 1.645, 1.906, 1.783, 1.604, 1.623, 1.702, 1.603, 1.685, 1.675, 1.636, 1.702, 1.674, 1.734, 1.68, 1.599, 1.652, 1.574, 1.9, 1.911, 1.809, 1.746, 1.559, 1.673, 1.75, 1.852, 1.758, 1.713, 1.796, 1.587, 1.704, 1.783, 1.662, 1.799, 1.603]
      df['Weight Change'] = [-13.0, -11.0, -5.0, -5.0, -4.0, -4.0, -4.0, -3.0, -2.0, -2.0, -3.0, -2.0, -1.0, -1.0, -2.0, -1.0, -1.0, 0.0, 1.0, 0.0, 0.0, 1.0, 0.0, 0.0, 1.0, 1.0, 1.0, 1.0, 1.0, 1.0, 1.0, 1.0, 1.0, 2.0, 2.0, 2.0, 2.0, 2.0, 2.0, 2.0, 2.0, 2.0, 2.0, 3.0, 3.0, 3.0, 3.0, 3.0, 3.0, 3.0, 3.0, 4.0, 4.0, 4.0, 4.0, 4.0, 4.0, 4.0, 5.0, 5.0, 6.0, 5.0, 6.0, 7.0, 7.0, 8.0, 11.0]
      df['Height Change'] = [-0.005, 0.002, 0.001, -0.002, 0.006, 0.001, -0.006, -0.005, 0.004, 0.004, -0.016, 0.001, 0.01, 0.01, -0.006, 0.001, -0.005, 0.002, 0.01, -0.005, -0.006, 0.01, -0.008, -0.007, 0.002, 0.002, -0.003, -0.003, -0.002, -0.004, -0.004, -0.003, -0.003, 0.008, 0.005, 0.006, 0.0, -0.002, -0.001, -0.002, -0.004, -0.004, -0.005, 0.006, 0.005, 0.001, 0.0, -0.004, -0.004, -0.006, -0.009, 0.002, 0.002, 0.002, 0.001, -0.001, -0.004, -0.007, 0.002, 0.0, 0.01, -0.007, 0.005, 0.004, -0.007, -0.009, 0.0]
      df['Number List'] = [0, 1, 2, 3, 4, 5, 6, 7, 8, 9, 10, 11, 12, 13, 14, 15, 16, 17, 18, 19, 20, 21, 22, 23, 24, 25, 26, 27, 28, 29, 30, 31, 32, 33, 34, 35, 36, 37, 38, 39, 40, 41, 42, 43, 44, 45, 46, 47, 48, 49, 50, 51, 52, 53, 54, 55, 56, 57, 58, 59, 60, 61, 62, 63, 64, 65, 66]
      df['BMI Change'] = [-3.88, -2.26, -1.66, -1.4, -1.41, -1.29, -1.36, -1.0, -1.02, -0.86, -0.74, -0.72, -0.53, -0.61, -0.57, -0.42, -0.24, -0.05, 0.1, 0.11, 0.15, 0.16, 0.21, 0.26, 0.21, 0.26, 0.38, 0.44, 0.36, 0.44, 0.45, 0.42, 0.43, 0.54, 0.43, 0.49, 0.78, 0.8, 0.73, 0.85, 0.79, 0.84, 0.94, 0.9, 0.97, 0.99, 1.08, 1.28, 1.2, 1.39, 1.03, 1.05, 1.18, 1.26, 1.64, 1.45, 1.4, 1.32, 1.57, 1.7, 1.61, 2.17, 1.94, 2.11, 2.66, 2.69, 4.29]
      df['Weight to Height Ratios'] = [0.0003846153846153846, -0.00018181818181818183, -0.0002, 0.0004, -0.0015, -0.00025, 0.0015, 0.0016666666666666668, -0.002, -0.002, 0.005333333333333333, -0.0005, -0.01, -0.01, 0.003, -0.001, 0.005, 0.002, 0.01, -0.005, -0.006, 0.01, -0.008, -0.007, 0.002, 0.002, -0.003, -0.003, -0.002, -0.004, -0.004, -0.003, -0.003, 0.004, 0.0025, 0.003, 0.0, -0.001, -0.0005, -0.001, -0.002, -0.002, -0.0025, 0.002, 0.0016666666666666668, 0.0003333333333333333, 0.0, - 0.0013333333333333333, -0.0013333333333333333, -0.002, -0.0029999999999999996, 0.0005, 0.0005, 0.0005, 0.00025, -0.00025, -0.001, -0.00175, 0.0004, 0.0, 0.0016666666666666668, -0.0014, 0.0008333333333333334, 0.0005714285714285715, -0.001, -0.001125, 0.0]
      print(df)
      fh.close()
Code for data manipulation
      ##convert each column into list
      #April
      weight_apr = []
      bmi_apr = []
      with open('freshman_kgs.csv', 'r') as csv_file:
          csv_reader = csv.reader(csv_file, delimiter=',')
          next(csv_reader)
          for lines in csv_reader:
            weight_apr.append(int(lines[2]))
            bmi_apr.append(float(lines[4]))
      print('Weight(April):', weight_apr)
      print('BMI (April):', bmi_apr)

      #September
      weight_sept = []
      bmi_sept = []
      with open('freshman_kgs.csv', 'r') as csv_file:
          csv_reader = csv.reader(csv_file, delimiter=',')
          next(csv_reader)
          for lines in csv_reader:
            weight_sept.append(int(lines[1]))
            bmi_sept.append(float(lines[3]))
      print('Weight(September):', weight_sept)
      print('BMI (September):', bmi_sept)


      ##finding height of each person using the equation height = (BMI/weight)^1/2
      #April
      height_apr = []
      for i in range(len(weight_apr)):
        height2 = (weight_apr[i]/bmi_apr[i])**(1/2)
        height_apr.append(float("{0:.3f}".format(height2)))
      print('Height(April):', height_apr)

      #September
      height_sept = []

      for i in range(len(weight_sept)):
        height1 = (weight_sept[i]/bmi_sept[i])**(1/2)
        height_sept.append(float("{0:.3f}".format(height1)))

      print('Height(September):', height_sept)

      ##finding height change of each person, weight change of each person and BMI change of each person
      #height change
      height_change_list = []
      for i in range(len(height_apr)):
          height_change = height_apr[i]-height_sept[i]
          height_change_list.append(float("{0:.3f}".format(height_change)))

      #weight change
      weight_change_list = []
      for i in range(len(weight_apr)):
          weight_change = weight_apr[i]-weight_sept[i]
          weight_change_list.append(float("{0:.3f}".format(weight_change)))

      #BMI change
      BMI_change_list = []
      for i in range(len(bmi_apr)):
          BMI_change = bmi_apr[i]-bmi_sept[i]
          BMI_change_list.append(float("{0:.3f}".format(BMI_change)))

      print('Weight Changes:',weight_change_list)
      print('Height Changes:',height_change_list)
      print('BMI Changes:',BMI_change_list)

      #list 0 to 66
      number_list = []
      for i in range(0,67):
        number_list.append(i)

      print('Number List:', number_list)

      #finding average weight change
      df_men = df.query('Sex== "M"')
      df_women = df.query('Sex== "F"')

      describe_all = df.describe()
      describe_men = df_men.describe()
      describe_women = df_women.describe()

      mean_weight_change_all_mean = describe_all['Weight Change'][1] # gives mean weight change for everyone
      mean_weight_change_men_mean = describe_men['Weight Change'][1] # gives mean weight change for men
      mean_weight_change_women_mean = describe_women['Weight Change'][1] # gives mean weight change for women

      # finding proportion of height change compared to weight change
      height_to_weight_ratios = []
      for i in range(0,67):
        if weight_change_list[i] == 0.0:
          value = height_change_list[i]
        else:
          value = height_change_list[i]/weight_change_list[i]
        height_to_weight_ratios.append(value)

      print("Height to Weight Ratios:",height_to_weight_ratios)
Code for "Change in Weight per Person" Graph
      import plotly.express as px
      weight_change = px.scatter(df, x='Number List', y='Weight Change',color = 'Sex',title='Change in Weight Per Person')
      weight_change.show()

      Code for "Average Weight Change by Gender" Graph

      import matplotlib.pyplot as plt

      width = 1

      # plot
      plt.bar(width,mean_weight_change_all_mean, label='All')
      plt.bar(2*width,mean_weight_change_men_mean, label='Men')
      plt.bar(3*width,mean_weight_change_women_mean, label='Women')

      plt.ylabel('Average Weight Change (kgs)')
      plt.title('Average Weight Change by Gender')

      # calculate x label locations
      x_label_locations = [width,2*width,3*width]
      plt.xticks(x_label_locations, ['All', 'Men', 'Women'])
      plt.ylim(1, 1.25)

      plt.show()

      Code for "Change in BMI per Person" Graph

      import plotly.express as px
      BMI_change = px.scatter(df, x='Number List', y='BMI Change',color = 'Sex',title='Change in BMI Per Person')
      BMI_change.show()

      Code for "Weight to Height Ratios" Graph

      import plotly.express as px
      weight_to_height_ratio_graph = px.scatter(df, x='Number List', y='Weight to Height Ratios',color = 'Sex',title='Weight to Height Ratios')
      weight_to_height_ratio_graph.show()