
Countries around the World have Various Currencies

Different Flags of Countries from Around the Globe

Map of the World's countries
Our project examines the relationship a country's GDP (gross domestic product) has on several variables: fertility rates, mortality rates, and life expectancy. We also take a country's population into account as that affects GDP per capita. Our project includes data from 72 countries ranging over the span of 10 years with our data being taken from the years 2010, 2015, 2020.

The upper images display the relationship between Colombia and Cambodia regarding GDP and mortality rates. As more years pass, the mortality rates decrease as the GDP increases in both countries. Although Cambodia's mortality rate is higher despite its higher GDP, we can see that its bigger increase in GDP is correlated to its bigger decrease in mortality rate.

Comparing Pakistan and Thailand, we can see that Thailand's higher GDP is correlated with its lower mortality rate. Although both countries' GDP fluctuate throughout the years, both countries see a decrease in mortality rates. As a countries' GDP and incomes increase, they gain better access to things like health services which tend to lead to improved health and therefore lower mortality rates.

Mexico and Ireland display a similar pattern to the countries shown above. As both nations' mortality rates decrease, though at a slower rate compared to the other nations due to the objectively lower starting values, GDP in millions of $ increases. Mexico consistently maintains higher rates of mortality than Ireland although its GDP is higher and this could be attributed to the quality of their healthcare systems, as Ireland is known for its top 20 best healthcare systems.

These two graphs demonstrate the relationship between fertility rates and GDP throughout the decade in the developing countries of Belize and the Dominican Republic. As GDP increases steadily throughout the decade in both countries, their fertility rates do as well. Belize consistently maintains higher rates of GDP and therefore higher fertility rates over the Dominican Republic.

As these data visualizations show, while the Bahamas began the decade with higher rates of fertility, it quickly fell and in 2012, Haiti overtook them with higher fertility rates. On the other hand, the Bahamas GDP in millions steadily increased while Haiti's began the decade increasing at the same rate, but plateaued off around the year 2015.

These two graphs compare the growth of fertility rates and GDP throughout the decade in millions of $ of Chad and Botswana. As displayed on the visualizations, the data shows that as Chad's GDP has fluctuated, but overall increased throughout the decade, its fertility rate has decreased by over 1%. We can see that Botswana's higher GDP is related to its lower fertility rate, which decreased but only by a small percentage. As for the GDP of the two nations, while Botswana's has been increasing throughout the entirety of the decade and accelerated in the year 2015, Chad's increased at a much slower rate and in fact decreased in the year 2015.

While the fertility rates of Yemen have consistently been decreasing throughout the decade, Zimbobwe initially increased but began decreasing at the turn of the decade. In addition the GDP in millions of $ between the nation differ as Yemen's slowly decreases until the year 2015, then sharply decreases. Zimbobwe, however, began the decade with a higher rate of increasing GDP then a slower rate around the year 2015.

This graph displays the mean total life expectancies throughout the decade for all 72 countries as well as the mean life expectancy for each gender. Throughout the decade, total life expectancies have increased due to improvements in technology and healthcare. We can also see that females have higher life expectancies. Research has indicated that the main contributing factor is higher cardiovascular disease morbity and mortality in men.
The visual above displays several select countries' GDPs throughout the decade from the years 2010, 2015, 2020. The nations with the lowest GDPs include Bulgaria, Bangladesh, and Costa Rica. Although there are fluctuations in several of the countries' GDPs, we can see that the majority experience an increase over the span of a decade.
The graph above demonstrates the same nations as the last graph and their respective life expectancies. Overall, the life expectancy of these individuals have increased over the years (ranging from 2010 to 2015 to 2020). We can then see a correlation between an increase in GDP to an increase in life excpectancy.
In this graph, we show various countries' GDP throughout the years, discounting large nations which skew the information and disproportionately display the data. In addition, over the past decade the GDP of these nations have varied greatly. However, they are relatively varied within their own ranges.
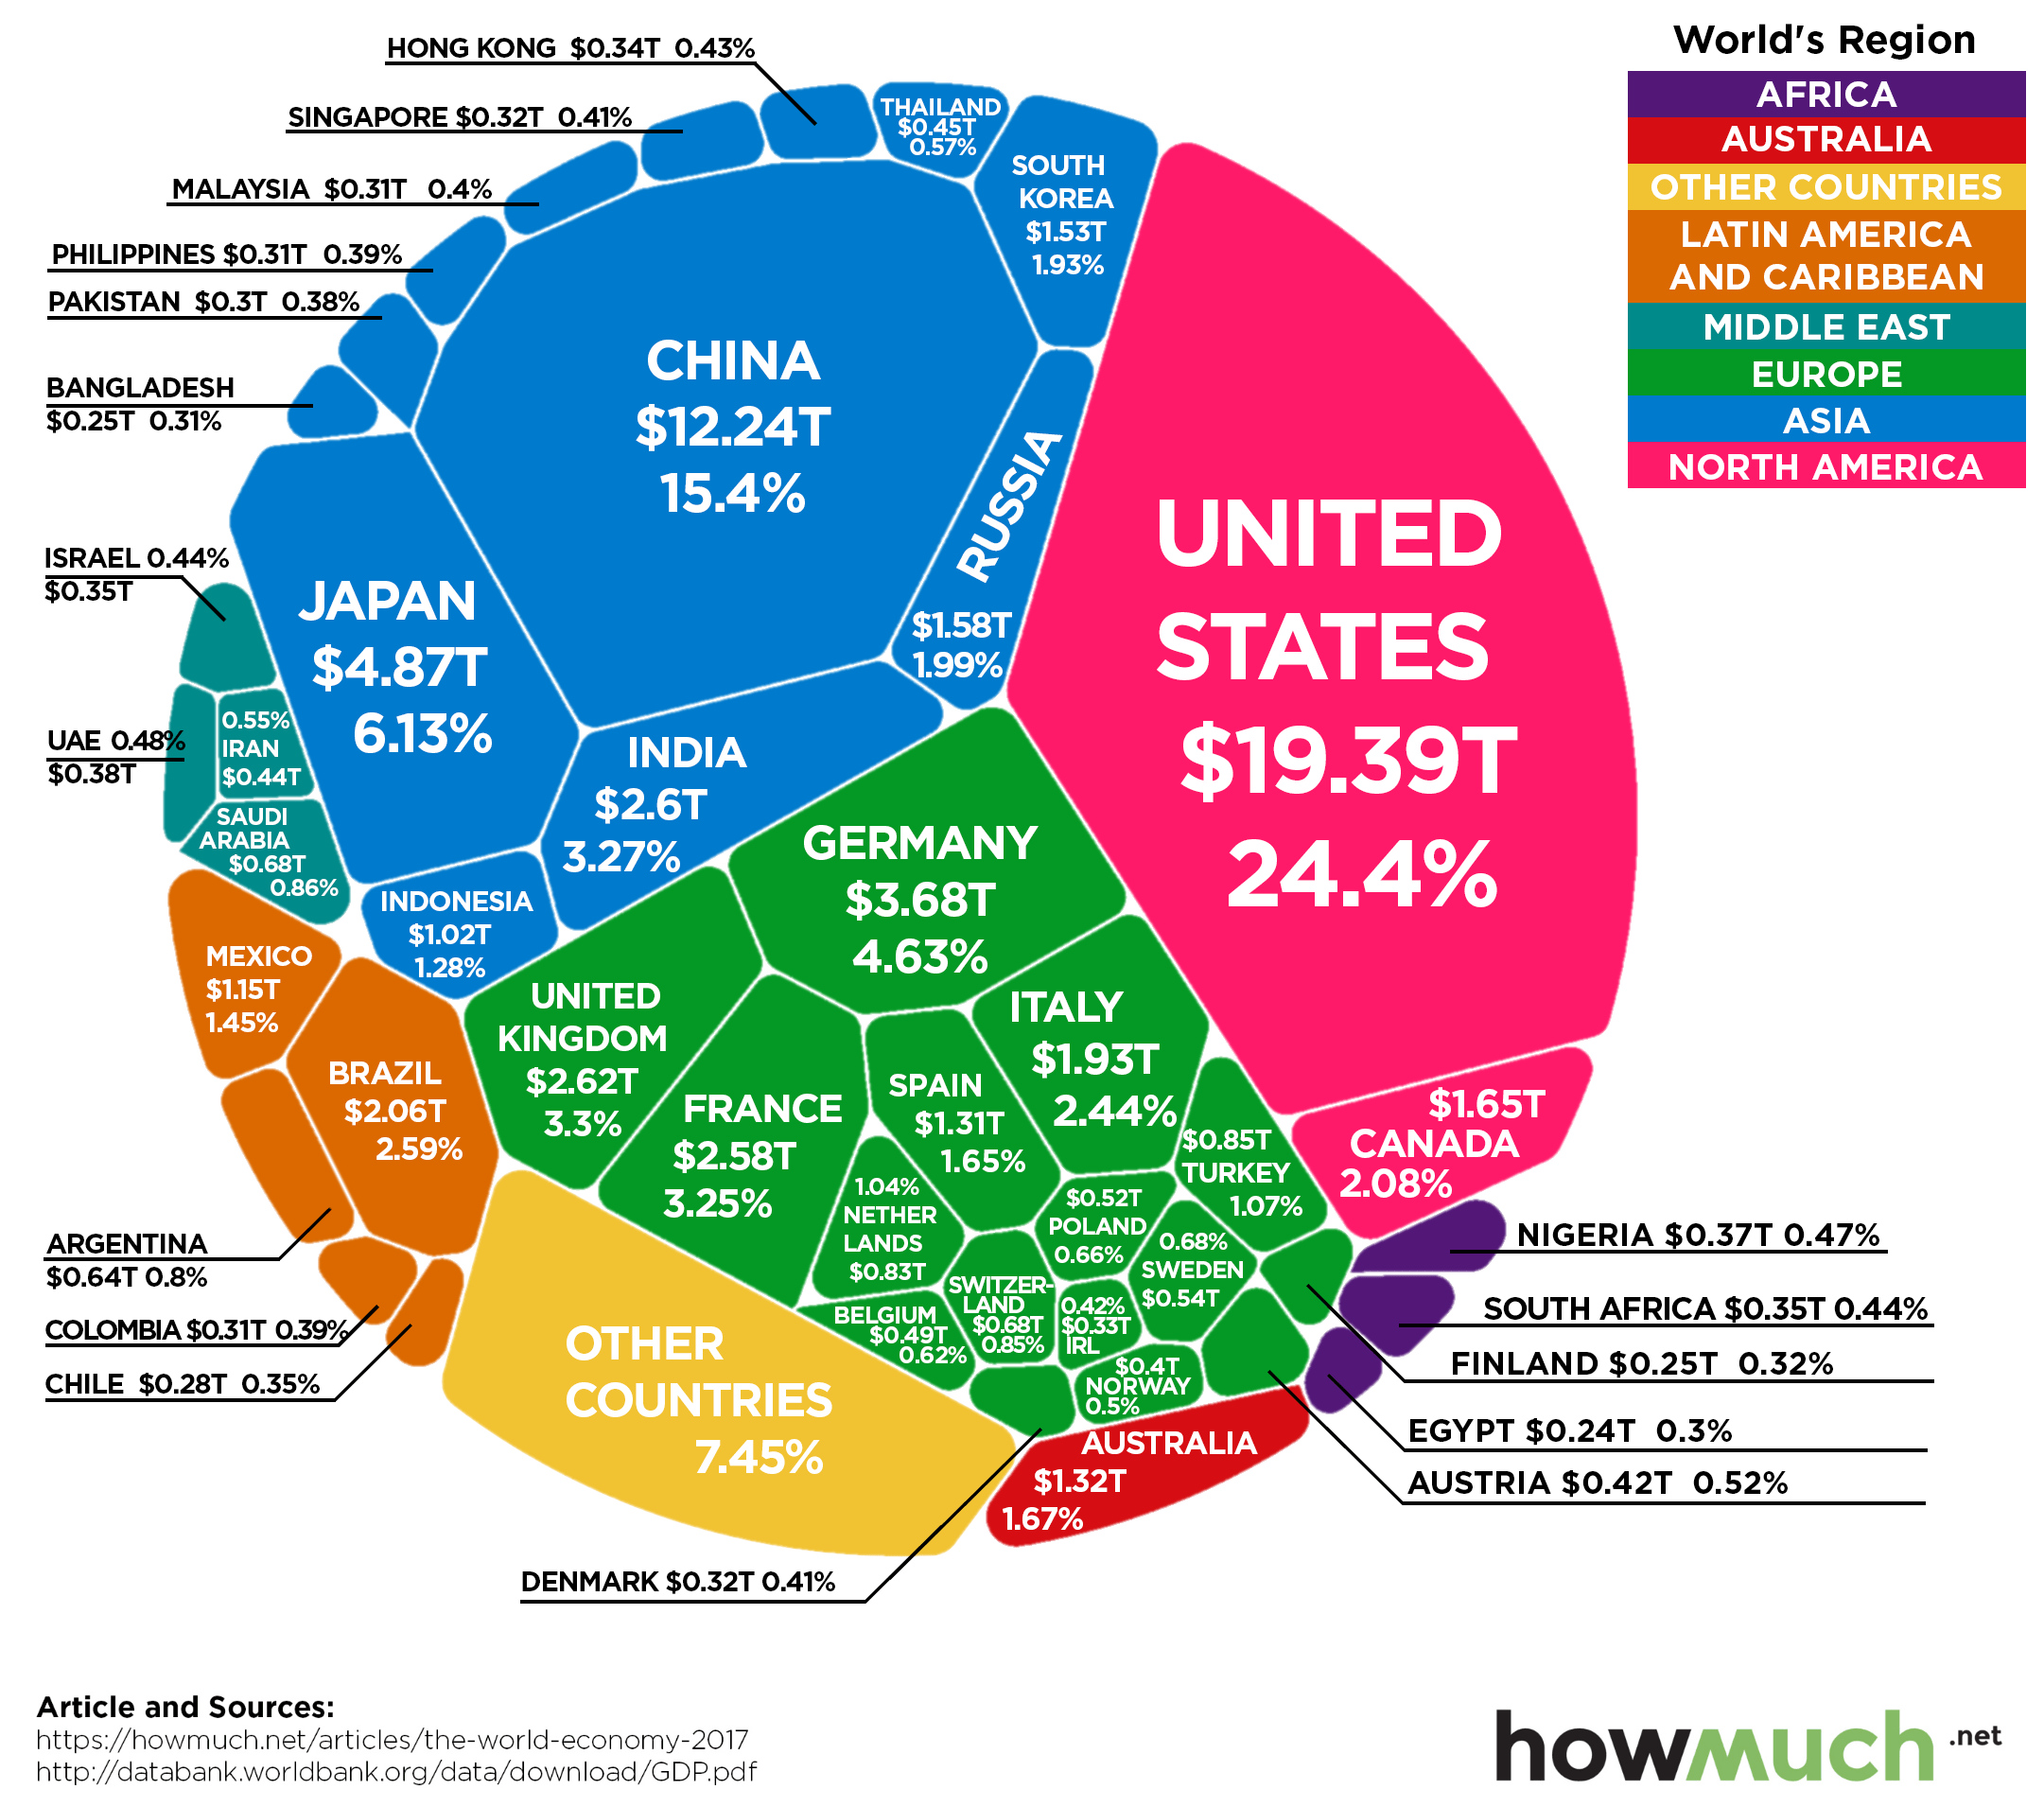
The top five world powers which maintain the highest rates of the world's GDP include China, France, Germany, Japan, and the United States of America. Out of these the United States of America has the greatest GDP and has been increasing at a steady and rapid rate. China has the second greatest GDP in millions of dollars and the greatest rate of increase across all nations during this decade.
A website displaying a series of data visualizations concerning the information on GDP in millions per dollars, mortality rates, fertility rates, and life expectancies.