Why do we need to keep Bees healthy?
Bees are incredibly important part of the ecosystems of the earth. Through pollination, Bees allow for the plants and trees that are key to human survival to thrive and multiply. For this project, we decided to take a closer look at the impact that climate change and changing weather patterns have on bee populations, honey production, and honey prices. We compared temperature and precipitation values through the years 1998-2012 to see if there is any correlation between these factors and used data for bee populations, honey prouction, and prices of honey from the same years. Please enjoy what we found.

Weather Patterns for the US
The above visualization shows average temperature vs the total precipitation by state over the years 1998-2012. However, this visualization also shows whether the or not the that state is considered hot (H) or cold (C) and wet (W) or dry (D). This will be helpful to consider with some of our later visualizations.
The above visualization helps to make the previous one more clear by separating each plot into a color dictated by the region of the US that that state is situated (i.e. the north, south, east, or western parts of the US). This visualization shows that Southern states have the highest amount of preiciptation and temperature on average while Western states have the lowest amount of precipitation and temperature on average.
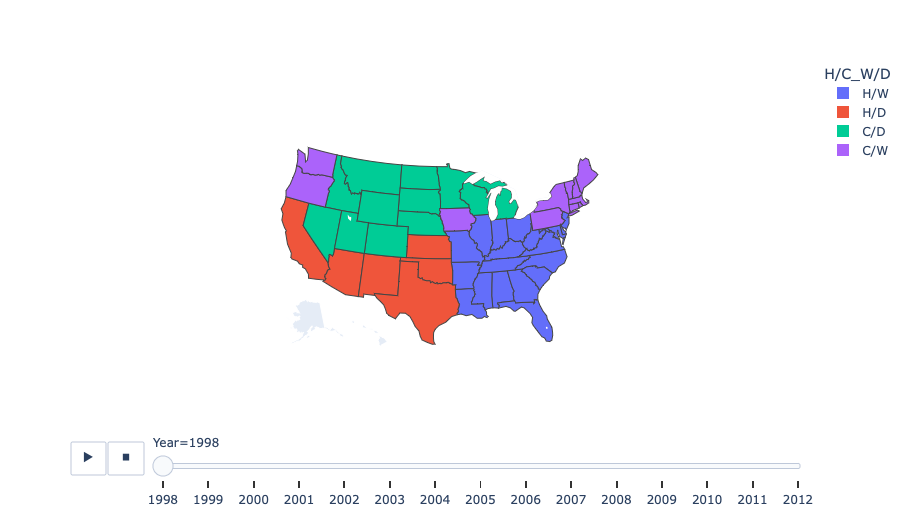
The graph to the right shows what states are condsidered to be hot/dry, hot/wet, cold/dry, or cold/wet. They change depending on the year so click on the full visualization to see how they differ per year. It is interesting however, that for the most part, the categories are all the same for surrounding states and they seem to follow the regions of being South, North, East, or West.
Weather Patterns vs Bee Populations
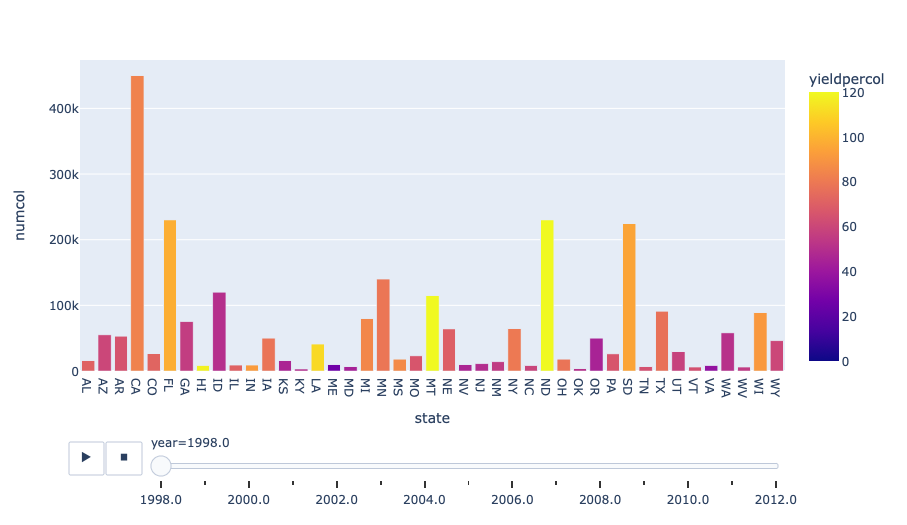
To the right is a bar chart of the number of colonies by state and the coloring is the yield per colony. You can see that even though a state might have a lot of colonies, it does not mean that those colonies are very productiove in creating honey.
Both Missouri and Hawaii have a very small number of colonies, but their colonies have some of the highest level of honey production. North Dakota has both high levels of production and high yield for each of its colonies.
To the right is a bar chart of the number of colonies by state and the color is the average temperature. In the beginning years, the states that have the greatest population of bees are warmer (California and Florida) but as the years progress, the colder states (North Dakota and South Dakota) have larger populations. Overall though, the correlation does not seem very strong. There is no trend that applies to all of the states.
As the temperaure of North Dakota gets colder, generally, the number of colonies increases. Similarly, as the temperature of California gets slightly colder, the populations seem to increase.

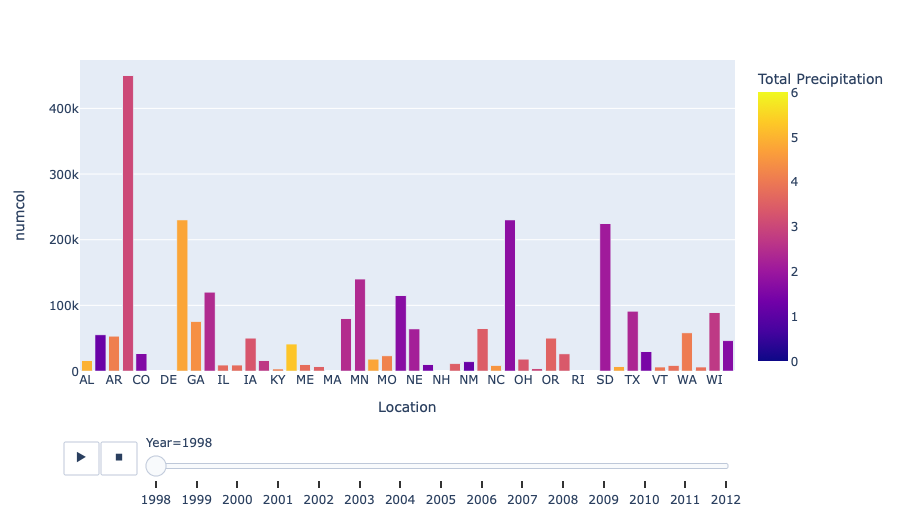
To the right is a bar chart of the number of colonies of bees by state and the color is total precipitation. For some states it seems that more precipitation increased population while for others it decreased population. Overall, it seems that the location had the most to do with bee populations and temperature did have some effect on population, but it was not dramatic.
As California has less precipitation the population of bees decrease. However, as the amount of precipitation in North Dakota decreases the populations of bees increases.
Bee Population vs Honey Production
While bees have many important jobs, they also produce a commodity that we love and many of us use daily. Honey production is a sign of healthy bees and so it can be used to see the effects, not only on the number of bees, but also on their well-being. In the next part of our project, we compared the weather patterns and bee population data to the honey production data in order to see what types of correlations these separate factors would have.
The above graphs show a map of the US compared to total precipitation and yield per colony separately. This seems to show that with lower precipitation there is less production of honey, but this is only true for some of the states throughout some of the years. So again, the correlation was not strong when looking at the US as a whole.
Louisiana's yield per colony increased with an increase in precipitation and Wyoming's yield per colony decreased with less precipitation.
The adjacent graph shows the number of bee colonies by the total production. The colors still each signify a different state and the size is consistent with the number of colonies. As was expected, as there is an increase in the number of bees, there is an increase in the amount of honey produced. The more bees there are to create honey, the more honey that will be made!
The states that have on average the greatest number of colonies and greatest amount of total production are California, Florida, North Dakota, and South Dakota.

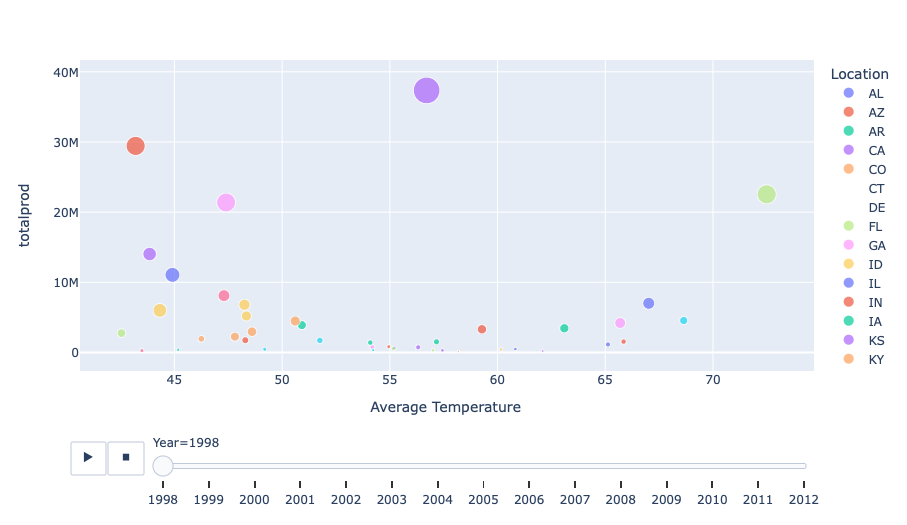
The adjacent graph shows the correlation between average temperature and honey production. The colors still each signify a different state and the size is consistent with the number of colonies. This visualization did not have a extremely clear correlation to be seen. It would appear that honey production has more to do with the location than the average temprature. Even though the average temperature of the states changed over time it had little effect on the production of honey
The biggest producers of honey (California, Florida, North Dakota, and South Dakota), had average temperatures that were on the lower side. Aside from Florida, which has temperatures in the 70-80s, the other big proucers stayed closer to the range of 45-60 degrees.
The adjacent graph shows the correlation between total precipitation and honey production. The colors still each signify a different state and the size is consistent with the number of colonies. This visualization showed that, on average, in states with lower amounts of precipitation more honey was produced. Although it varies from state to state, those states who had the greatest production of honey also had relatively low amounts of total precipitation.
California on average produced much more honey when it had higher amounts of precipitation. Similarly, this can be seen in South Dakota and North Dakota but it is a less clear correlation in the other states

A New Way Of Looking At It:
When we were looking at this data, there did not seem to be any specific or incredibly clear correlation between these data points. So we decided to try and find a different way of looking at the data, and as our very first visualization suggests, we split up the states based on their traits of being hot vs cold, and dry vs wet. This comparison ended up giving a correlation that was much more clear and easy to understand.
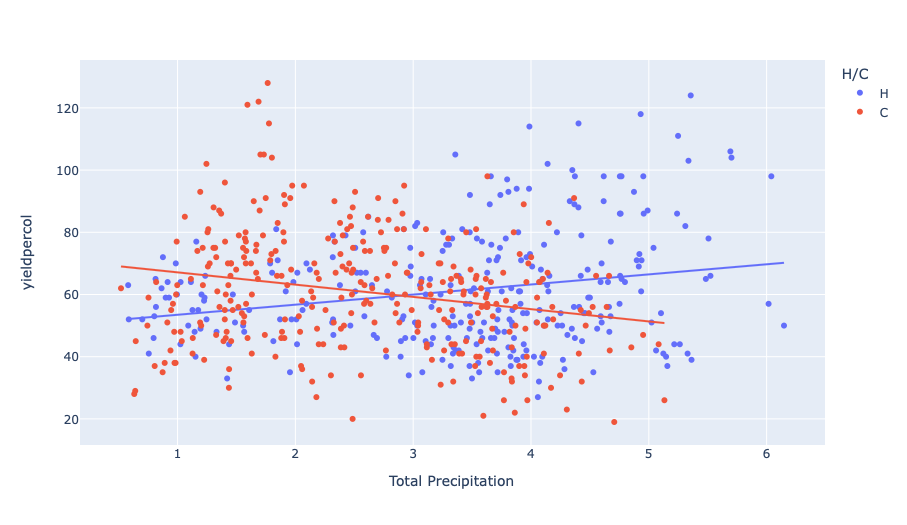

The visualization on the left shows the correlation between total precipitation and the yield of honey per colony while relating it to states that are either considered to be hot or cold. This visualization shows that hotter states do better with a higher amount of precipitation while colder states do better with drier conditions. Similarly, the visualization on the left shows the correlation between total precipitation and the yield of honey per colony while relating it to states that are either considered to be hot or cold. This visualization shows that hotter states do better with a higher amount of precipitation while colder states do better with drier conditions.
*** For wet states the correlation shows that every 1 degree increase in temperature improves honey yield by 1.25 pounds. It is not a weak correlation either, with an R^2 value of .25. While this does not say anything about causation, it does point to two 'best cases' for producing honey. It suggests that honey is best produced in a hot, wet environment or a cool, dry environment. While this might seem counterintuitive, it might make sense that they can only handle the cold if it's dry (not much snow) and the heat if there is water to cool off with.
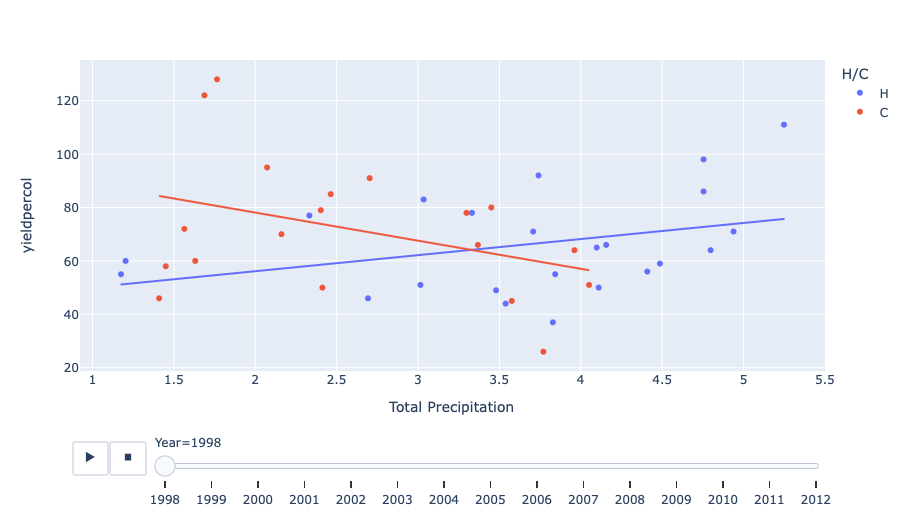

We can see the same thing as above here, but these are separated by year, showing that it is fairly consistent each year for this pattern to occur. This helps to confirm our correlation.
-

See Full Visualization
The adjacent graph shows the number of colonies of bees based on the enivronment being a combination of either hot and cold or dry and wet. This graph shows that the states which have the greatest number of colonies of bees are ones that are cold and dry. The cold and dry states have 19,912,000 colonies compared to cold and wet states which have 2,810,000 colonies which is almost 7x as many colonies. -

See Full Visualization
The adjacent graph shows the number of honey stocks based on the enivronment being a combination of either hot and cold or dry and wet. This graph shows that the states which have the most amount of honey stocks are ones that are cold and dry. The hot and dry states have 142,163,000 stocks whereas hot and wet states have 82,015,000 stocks -

See Full Visualization
The adjacent graph shows the yield of colonies based on the enivronment being a combination of either hot and cold or dry and wet. This graph shows that honey is best produced in cold dry climates. Even though there are not as many colonies in hot and wet states, they produce almost the same amount of honey as hot and dry states.
-

See Full Visualization
The adjacent graph shows what happens when you put all of this data together. This shows that bees produce the most honey when they are either in cold and dry environments or they are in hot and wet environments. This was our prediction from the beginning and this graph shows this to be true!
Together, these graphs make it clear that the states that are able to have the best bee populations and produce the most honey are states that are dry and cold. The worst conditions for bees are states that are both hot and dry.
Bee Population vs Honey Price
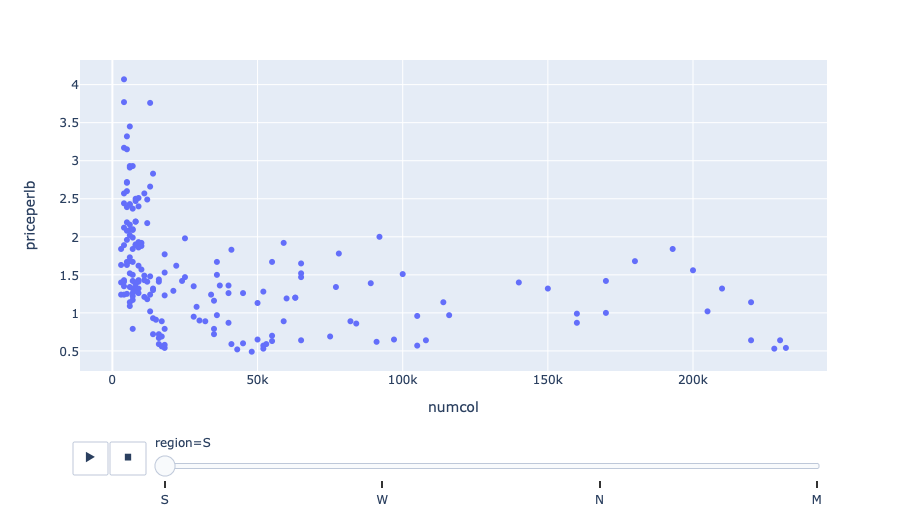
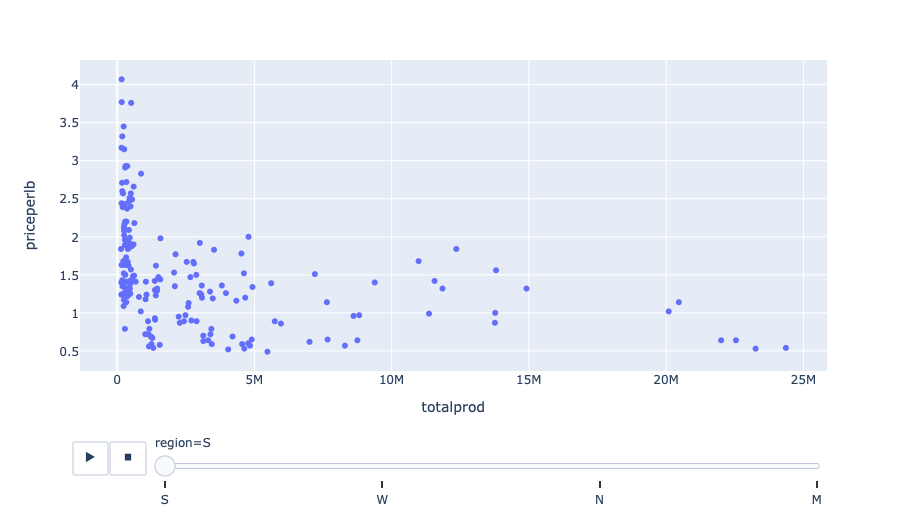
The graphs above show both price of honey per pound vs the number of colonies and then by the total production of honey within a region of the US during 1998-2012. These graphs both have a clear correlation that the price of honey is higher when there are fewer colonies and when there is less honey produced. This would make sense because of the principals of supply and demand and show because less bees means less honey which would show why the two graphs look very similar.
The most expensive states for honey are Virginia, Nevada, New Jersey, and Illinois. All of these states are produce realtively low amounts of honey and have relatively low numbers of bee colonies.
Thank you for reading
This project has made it aBEEndantly clear that the weather does effect the bees (but it also depends on the region those bees live in). As climate change continues to effect weather patterns making them more sporadic, the safety of bees is at risk. Now if you don't really care about bees, you just might care about honey. With fewer bees, the amount of honey will decrease and the price of it will increase. To keep our furry friends safe, make sure that you protect your environment and are careful with the emissions you release that are adding to the issue of climate change and the fluctuation in weather patterns. Also if you are so inclined to help the bee population by keeping your own bees and getting your own honey, consider living in a cold and dry climate for the best results. Thank you for reading.