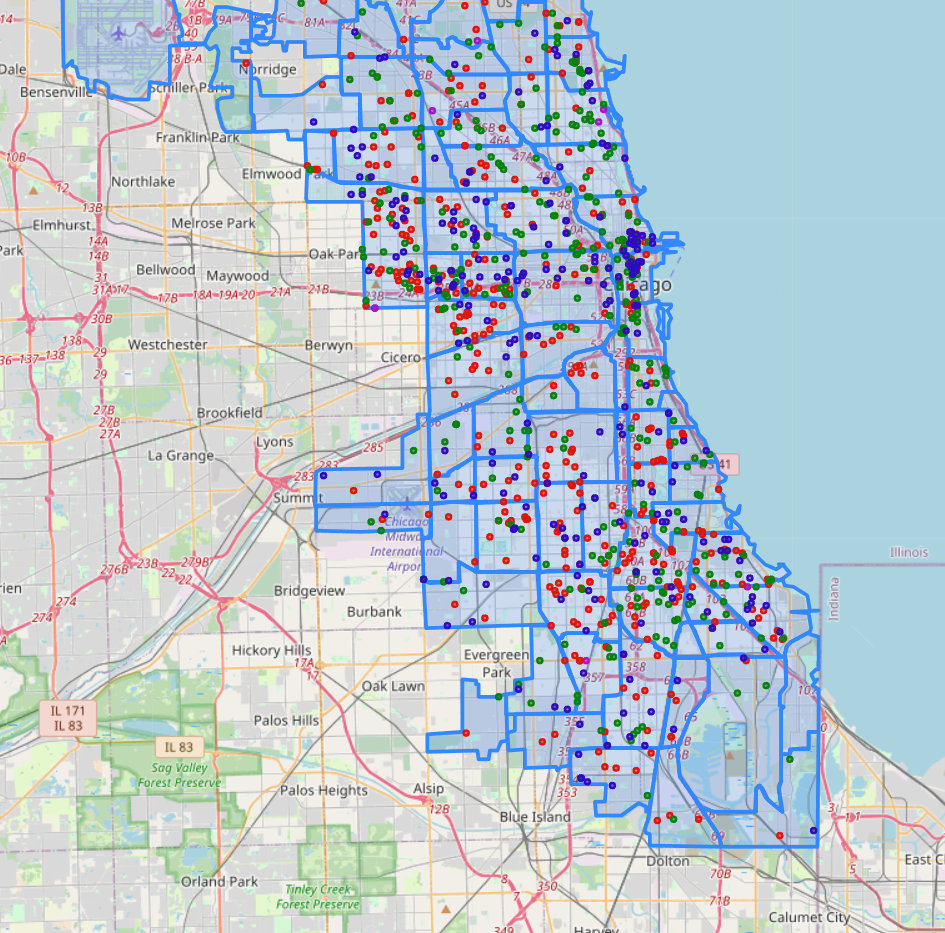
Color Coded Crime Map -- Take a look at Chicago crime, based on the type.
Displays the 1000 most recent Chicago crimes as plotted points, based on location. Colors are by violent, theft, sex, and other crimes. Click the image to the right to interact!
Insights:
Crimes occurring in the Loop are mostly theft, and some other offenses such as criminal trespassing.
In the residential areas outside of downtown, much more of the crimes are violent, like battery, assault, and weapons violations.
There is very little sexual assault when compared to other crimes. Of the few sexual assault crimes, their locations are sporatic.
This may contrast the conventional thought that downtown is the most dangerous area.
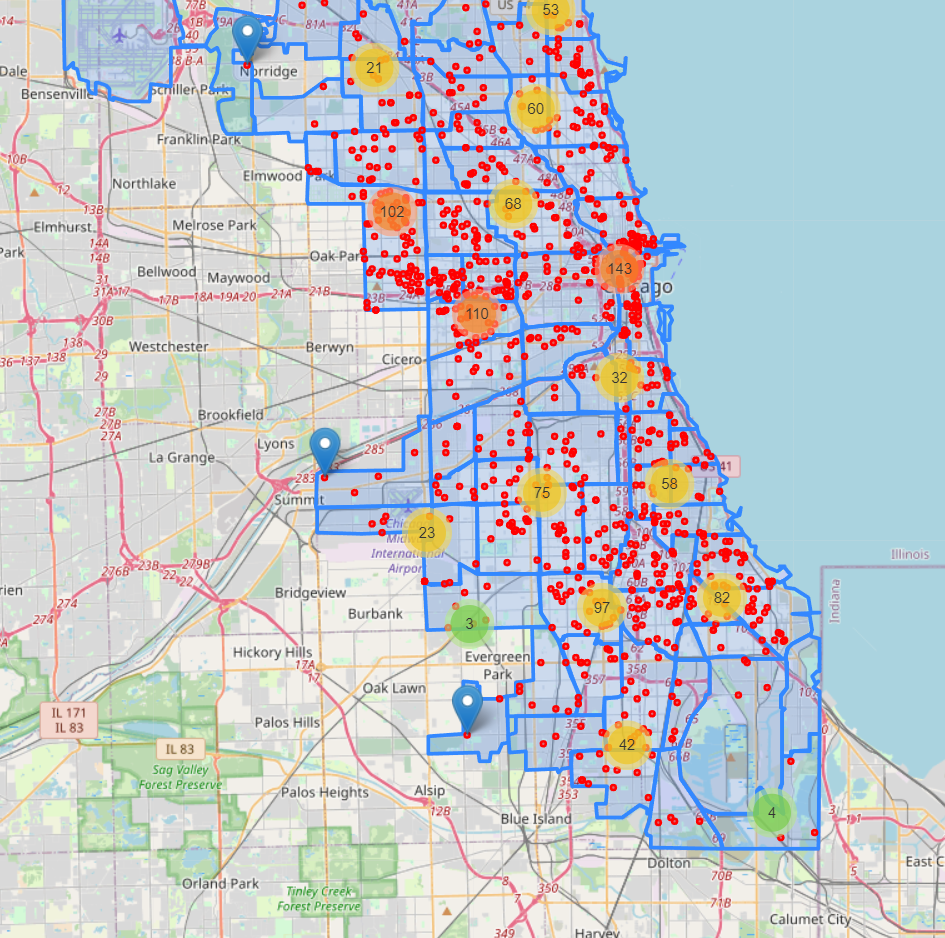
Cluster Crime Map -- See the frequency of Chicago crime, based on region.
Displays the 1000 most recent Chicago crimes in clusters. Based on the map's relative distance from the city, the number of crimes in a particular area is displayed. Gets more specific the more a user scrolls in. Click the image on the left to interact!
Insights:
As of recently, more crime occurs to the North/West than the South.
Essentially no crime occurs in the southernmost part of the greater Chicago area. This is likely because it is an industrial area.
Essentially no crime occurs around O'Hare International Airport - only one occurred within a 5 mile radius.
Compared to O'Hare, significantly more crime occurs around Midway International Airport - around 20 occurred within a 5 mile radius.
This supports the idea that O'Hare is a safer place to travel to and from.
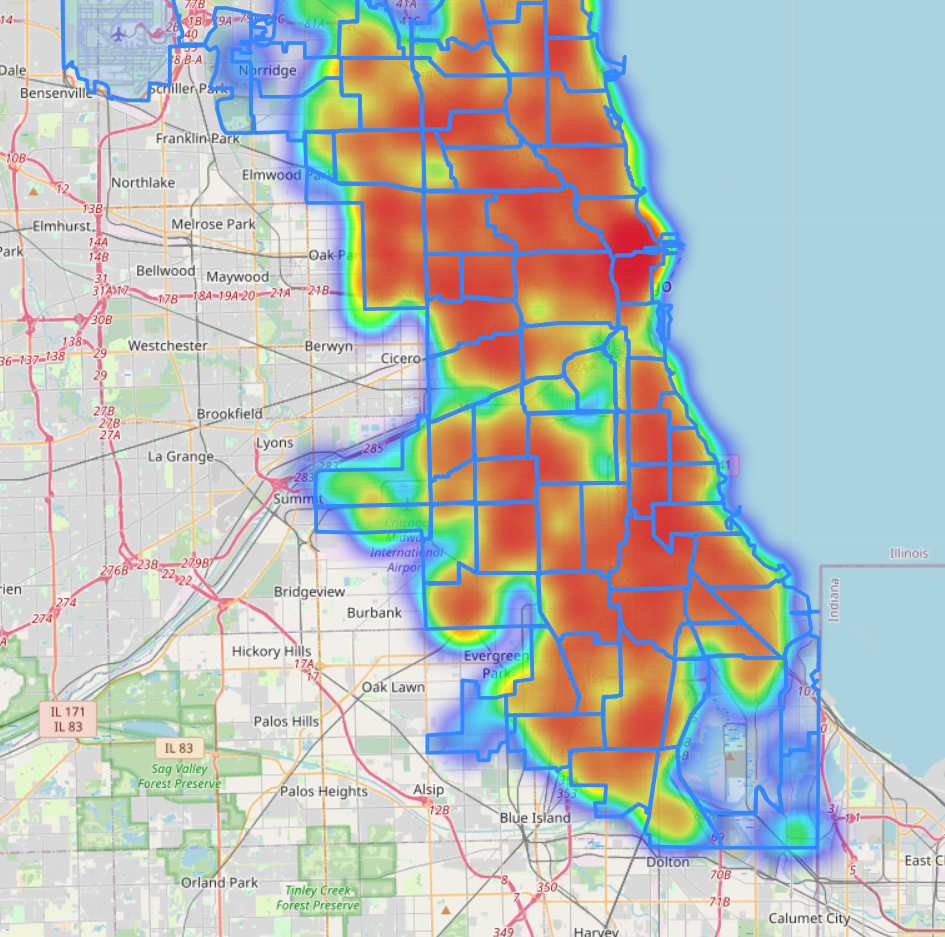
Crime Heat Map -- View the magnitude of crime in the greater Chicago area.
Takes the 1000 most recent Chicago crimes and displays the magnitude of crime location through heat color. Click the image on the right to interact!
Insights:
Crime is most dense around the Loop.
Outside of the Loop, recent crime appears relatively dense all over in surrounding areas.
Given its uniform density, most Chicago residential areas experience frequency of crime that is relatively on par with one another.
This may reinforce conventional thought that Chicago is a place of crime.
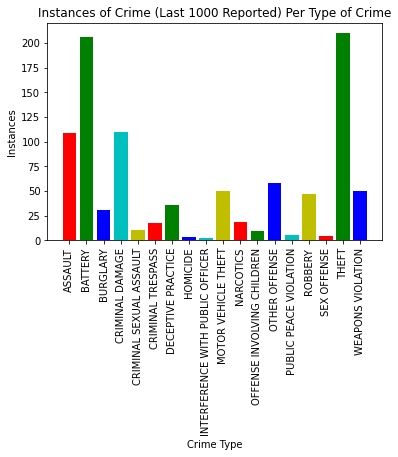
Crime Bar Graphs -- See the same crimes, but in a different way.
Looking for something other than maps? Take a look at the crimes, but in bar graph form. Pictured to the right is all 1000 recent crimes in Chicago, and below is the recent crime in three specific counties.
Insights:
Out of the 1000 most recently reported crimes, the most common are battery and theft. Both are around 200/1000, making up around 40% of recent Chicago crimes.
Assault and criminal damage are the next two highest types of crime. Both are around 100/1000, making up around 20% of recent Chicago crime.
Comparitavely, sexual assault is only 13/1000 of the crimes - around 1%.
Homicide is only 5/1000 of the crimes, or less than 1%.
The small amount of homicides and sexual assault may conventionally come off as less than expected.
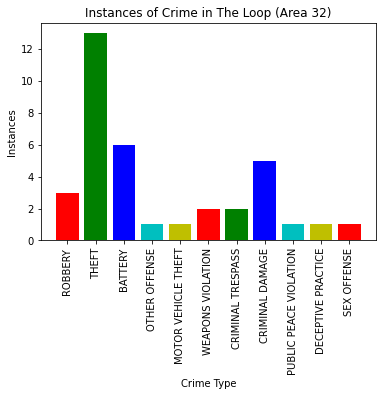
The Loop Graph
Bar graph of the recent crime in the Loop county.
Insights:
Theft is by far the most common crime occurring.
The next closest crimes are battery and criminal damage.
If there is a crime in the Loop, it is likely theft. This common occurrence of stealing makes sense, given that downtown Chicago is a place of many stores and tourists.
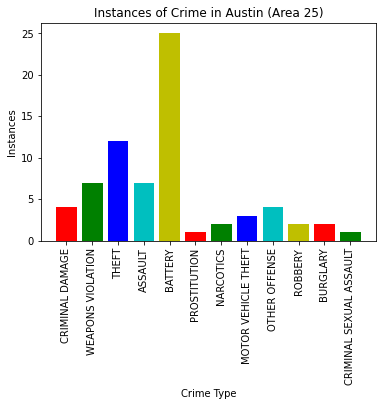
Austin Graph
Bar graph of the recent crime in Austin county (West of downtown).
Insights:
Austin county is a residential area.
Battery is by far the most common crime; theft comes in second.
As opposed to the Loop's theft, battery is the common crime here. This makes sense, since it is a place where people live. This shows that the types of crime differs depending on the area of the city.
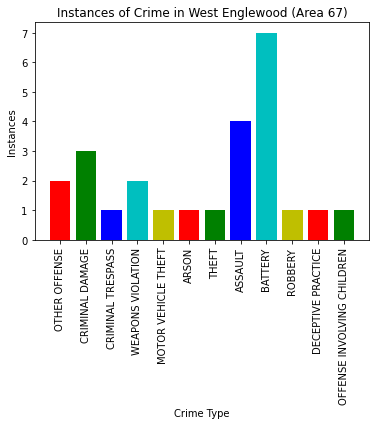
West Englewood Graph
Bar graph of the recent crime in West Englewood county (South of downtown).
Insights:
West Englewood is a residential area.
Battery is by far the most common crime occurring. Assault comes in second, followed by criminal damage.
As opposed to the Loop's theft, battery is the common crime here. This makes sense, since it is a place where people live. This shows that the types of crime differs depending on the area of the city.