
CETR -- Content Extraction with Tag Ratios
Tim Weninger, William H. Hsu, Jiawei Han. CETR -- Content Extraction with Tag Ratios. Proceedings of the 19th International Conference on World Wide Web. pages 971--980. Raleigh, North Carolina, USA. ACM. New York, NY, USA
ACM Portal | Powerpoint Slides
Keywords: content extraction, tag ratio, world wide web
Abstract
We present Content Extraction via Tag Ratios (CETR) -- a method to extract content text from diverse webpages by using the HTML document's tag ratios. We describe how to compute tag ratios on a line-by-line basis and then cluster the resulting histogram into content and non-content areas. Initially, we find that the tag ratio histogram is not easily clustered because of its one-dimensionality; therefore we extend the original approach in order to model the data in two dimensions. Next, we present a tailored clustering technique which operates on the two-dimensional model, and then evaluate our approach against a large set of alternative methods using standard accuracy, precision and recall metrics on a large and varied Web corpus. Finally, we show that, in most cases, CETR achieves better content extraction performance than existing methods, especially across varying web domains, languages and styles.
Details
The Problem
 Typical Web pages contain lots of information. We argue that a lot of the space on a Web page is filled with advertisements, navigational menus, copyright information, and other items, which should not generally be considered content. For many reasons we ought to find ways to extract only the content of a Web page (green box in Web page on right), and throw out all of the non-content junk.
In the past, Web researchers relied mostly on Web wrapper induction to extract content. But these wrappers need to be trained on lots of hand-labeled examples, which takes time, and whenever a Web page is redesigned, even slightly, the wrapper will cease to function. So, what we need is an unsupervised content extractor, that is, an extractor that does not need training nor periodic updating.
Tag Ratios Our solution is the use of the text to tag ratio of lines in a Web page. The intuition behind this approach is that Web pages are designed and maintained by human developers, and that those developers generally use many lines of HTML code when designing the Web page -- even if the page is dynamic. We intuit that some of these lines of code contain mostly content and the remainder are non-content lines. So which are which?
To answer this question we look at the ratio of the number of HTML tags in a line of code to the number of non-HTML-tag characters. We call this the text to tag ratio (TTR). The table below shows some example text to tag ratios for a news article.
| HTML code | Text | Tags | TTR |
|---|---|---|---|
| <div id="topnav"> | 0 | 1 | 0 |
| <div id="storyPageContent2"> | 0 | 1 | 0 |
| <div id="author">James Smith</div> | 11 | 2 | 5.5 |
| OKLAHOMA CITY - Police were told that | 37 | 0 | 37 |
| The Oklahoman reported Sunday. <br><br> Jones had | 41 | 2 | 20.5 |
| </div></div> | 0 | 2 | 0 |
By finding text to tag ratios for each HTML line in the Web page we generate an array of ratios, essentially a TTR histogram. The image to the right shows 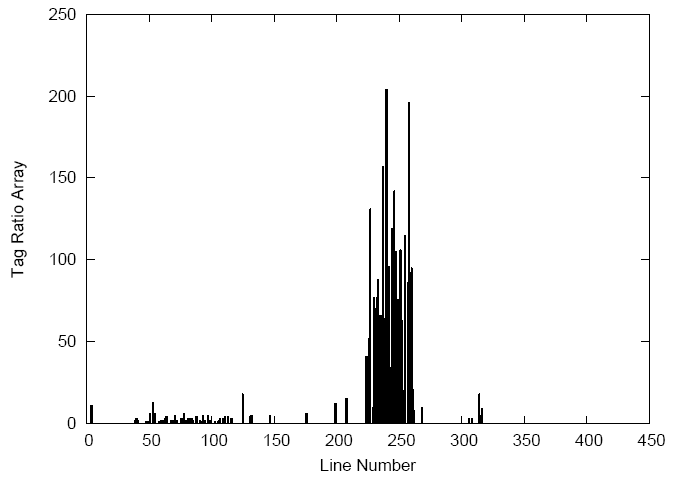 an actual TTR histogram of a news Web page. It turns out the lines 1-40 occupy HTML meta information and the <head> tag. Lines 41-220 contain the navigational menus and advertisements; the low TTR scores are because these non-content areas usually have very little text and lots of formatting. Lines 221-260 contain the content of the page corresponding to a large jump in the TTR ratio. The remainder of the page is footer formatting and copyright information. Unfortunately, not all pages are as clear as this example, so the next
 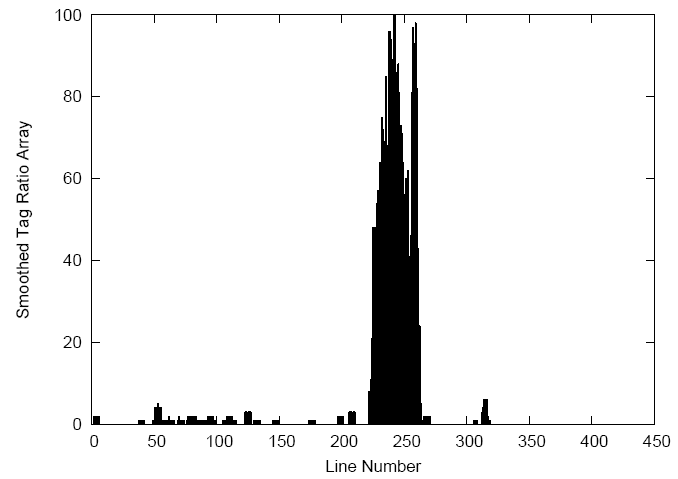 step is to smooth the TTR histrogram to account for less-clear Web pages.
Smoothing the TTR Ratio
We perform a Gaussian smoothing with a radius of 3. There is some math behind this, please see the paper for details. There is no specfic reason to why we chose the Gaussian smoothing, any other distribution could be substituted. 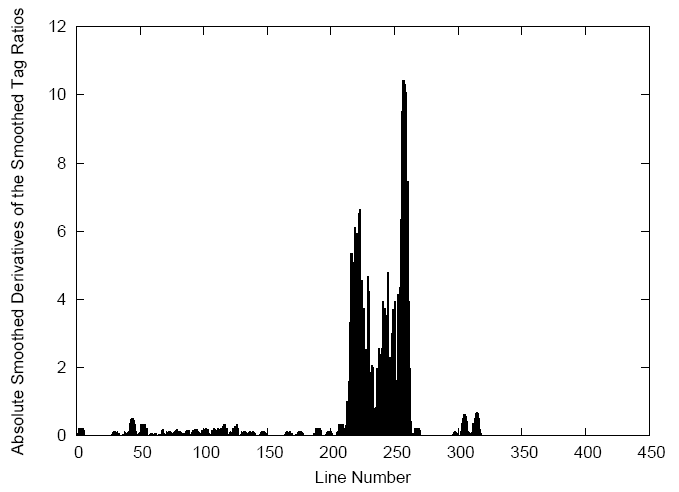 The important take away here, is that once the TTR histrogram above is smoothed we get a clearer picture of the content section shown in the image at right. As you can see, this smoothed histogram tells us a lot about the content, but it would be even better if we could tell when the content starts and stops, especially for Web pages that have multiple content sections.
Finding the beginning and end of content sections
Intuitively, the beginning and end of content sections are marked by sudden rises and drops in the TTR ration as our eyes move from left to right. We can represent this mathematically by taking the absolute derivative of the smoothed TTR histogram. 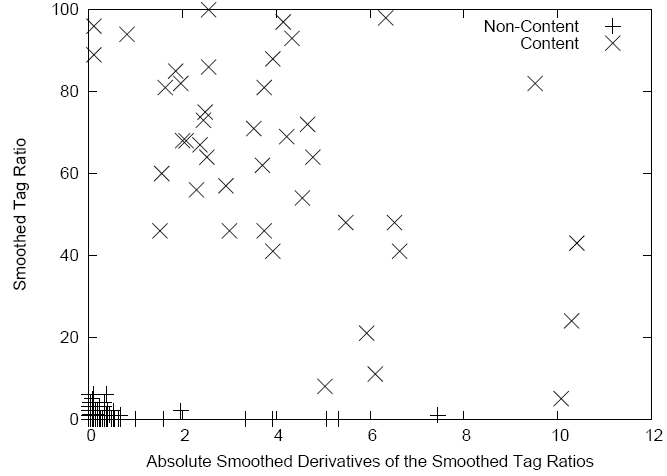 The result is shown in the image at left. We see that the two peaks in the derivative array correspond to the beginning and end of the content section. Finally we want to use this information to automatically recognize the content section.
Extraction in two dimensions Now that we have the smoothed TTR array and the absolute derivatives we can plot these in two dimensions creating a scatterplot at right. If that scatterplot is manually labeled, we find that the non-content lines are very near the origin and the content lines are spread away from the origin. Most modern clustering algorithms can easily spot this dicotomy. We specifically use the k-Means clustering algorithm, implemented by the Weka project. We tried k=2 and k=3 and always set the cluster with the centroid closest to the origin as the non-content cluster, the remaining clusters were always labeled to be content. Of course, this works well on our example, but does it work on a large variety Web pages?
Experiements Because there has been a lot of research on this area several past studies have used different data sets for their experiments. We specifically used the news corpus data set from Pasternak et al.'s WWW'09 paper and the CleanEval data set. Evaluation was with traditional precision and recall measures. The table below shows a summary of the results with F1-measure.
| Algorithm | CleanEval-Eng | CleanEval-Zh | CleanEval-Avg | Myriad 40 | Big 5 | NyTimes | BBC | Average |
|---|---|---|---|---|---|---|---|---|
| FE | 7.86% | 3.50% | 5.68% | 4.63% | 8.27% | 2.35% | 17.14% | 7.29% |
| KFE | 89.19% | 45.68% | 67.44% | 71.41% | 71.36% | 94.30% | 78.13% | 75.01% |
| BTE | 93.13% | 18.52% | 55.83% | 68.97% | 64.58% | 93.49% | 63.93% | 67.10% |
| DSC | 80.92% | 5.00% | 42.96% | 84.59% | 81.54% | 89.69% | 80.96% | 70.45% |
| ADSC | 86.70% | 5.13% | 45.91% | 86.41% | 80.27% | 96.06% | 96.64% | 75.20% |
| LQ | 91.96% | 58.47% | 75.22% | 70.25% | 54.96% | 93.42% | 64.00% | 72.18% |
| LP | 49.65% | 55.41% | 52.53% | 83.11% | 25.89% | 97.35% | 90.48% | 66.98% |
| CCB | 91.57% | 58.99% | 75.28% | 77.05% | 68.21% | 98.09% | 71.90% | 77.64% |
| MSS | 91.98% | -- | -- | 94.64% | 95.13% | -- | -- | 93.92% |
| VIPS | 93.41% | 39.43% | 66.42% | 92.97% | 95.59% | 95.61% | 84.77% | 83.63% |
| CETR-TM | 94.10% | 86.55% | 90.33% | 91.44% | 81.27% | 97.11% | 98.26% | 91.45% |
| CETR-KM | 94.68% | 86.50% | 90.59% | 94.17% | 91.23% | 98.40% | 97.01% | 93.66% |
| CETR | 94.72% | 86.62% | 90.67% | 94.72% | 91.82% | 98.21% | 97.46% | 93.93% |
Future WorkThe task of automatic content extraction remains a hot topic especially with the colossal amount of information being added to the Internet every day. With that in mind, there some portions of this specific approach that need further exploration. I am not working on this task specifically anymore, but I think there are many challenges that remain. First, we should incorporate this method into standard search engines in order to see what effect, if any, it has on the result relevance. For instance, many webpages include word strings and links in order to boost their search engine rank, if we can filter the irrelevant text from the page during indexing then it may be possible to present more relevant search results.
Another area for further investigation is the clustering algorithm used in CETR. We do not claim that our clustering method is optimal, in fact, a linear max-margin clustering approach may give better results. Furthermore, our approach as the potential to delinate between different content sections in a Web page; perhaps this can be used to also improve search engine retrieval and ranking.
Special ThanksThomas Gottron implemented most of the comparison algorithms used in this work. Jeff Pasternack, author of MSS, allowed us to use his news data and gave us access to the CleanEval data. The work was sponsored by the NDSEG fellowship program.
Data and Code
Data set The data for this project has several parts: (1) The news section, which contains the original and manually cleaned documents. The manually cleaned documents still have HTML code, but most (hopefully all) of the non-tag text is content; (2) The cleaneval section, which contains nearly 1000 random documents that are cleaned. I only used the subset of those documents (640 in total) in my experiements. You can download the dataset here: CETR Dataset (60Mb zip)
Source code There are three main files that contain the three different implementations of the CETR code. They can be found below:
In addition, this code references two files found in LingPipe:- Statistics © Lingpipe Research Only License
- Mathematics © Lingpipe Research Only License
- Weka © Weka GPLv3
- Parser © htmlparser Common Public License
- Lexer © htmlparser Common Public License
- Log4j © Apache Apache Software License v2
Data and Code
Why don't I get the same results as you? Two reasons: (1) I didn't use all of the CleanEval data set, I restricted it to pages that actually have text. (2) There is randomness in the clustering algorithm, perhaps your seed is different.
What if the Web page has all of the code on one line? Good question. When this happens we insert a newline character into the HTML code after 60 (or so) characters. If that 60th character is in the middle of a tag, then we insert the newline after the end of the tag.
How do I turn it on?The downloadable code is in the form of a static library, i.e., there is no main method. To use the program out of the box use the function: extractText(String html, int k), where html is HTML markup, and k is the number of clusters (k=3 seems to work well). This function returns the content of the Web page.