This Is Not The Course Website You Are Looking For
This course website is from a previous semester. If you are currently in the class, please make sure you are viewing the latest course website instead of this old one.
Homework 05: Data Processing
The goal of this homework assignment is to allow you to practice using Python to create scripts that require sophisticated parsing of data and manipulation of data structures. In this assignment, you will download data in both CSV and JSON format, process it, and then present it to the user in the terminal.
For this assignment, record your scripts and any responses to the following
activities in the homework05 folder of your assignments GitHub
repository and push your work by noon Saturday, March 4.
Activity 0: Preparation
Before starting this homework assignment, you should first perform a git
pull to retrieve any changes in your remote GitHub repository:
$ cd path/to/repository                   # Go to assignments repository

$ git checkout master                     # Make sure we are in master branch

$ git pull --rebase                       # Get any remote changes not present locally
Next, create a new branch for this assignment:
$ git checkout -b homework05 # Create homework05 branch and check it out
Once this is done, download the Makefile and test scripts:
# Go to homework05 folder
$ cd homework05

# Download the Makefile
$ curl -LO https://raw.githubusercontent.com/nd-cse-20289-sp23/cse-20289-sp23-assignments/master/homework05/Makefile

# Add and commit Makefile
$ git add Makefile
$ git commit -m "homework05: add Makefile"

# Download the test scripts
$ make test-scripts
You are now ready to work on the activities below.
Frequently Asked Questions
Note, you do not need to add and commit the test scripts since the Makefile will automaticaly download them again whenever you run make.
Activity 1: Reddit (5 Points)
Katie likes to sit in the back of the class. It has its perks:
-
She can beat the rush out the door when class ends.
-
She can see everyone browsing Facebook, playing video games1, watching YouTube, or doing homework.
-
She feels safe from being called upon by the instructor... except when he does that strange thing where he goes around the class and tries to talk to people. Totally weird 2.
That said, sitting in the back has its downsides:
-
She can never see what the instructor is writing because he has terrible handwriting and always writes too small 3.
-
She is prone to falling asleep because the instructor is really boring and the class is not as interesting as her other computer science courses.
To combat her boredom, Katie typically just browses Reddit. Her favorite subreddits are AdviceAnimals, aww, todayilearned, and of course UnixPorn. Lately, however, Katie has grown paranoid that her web browser is leaking information about her4, and so she wants to be able to get the latest links from Reddit directly in her terminal.
Fortunately for Katie, Reddit provides a JSON feed for every subreddit.
You simply need to append .json to the end of each subreddit. For
instance, the JSON feed for todayilearned can be found here:
https://www.reddit.com/r/todayilearned/.json
To fetch that data, Katie uses the Requests package in Python to access the JSON data:
r = requests.get('https://www.reddit.com/r/todayilearned/.json')
print(r.json())
429 Too Many Requests
Reddit tries to prevent bots from accessing its website too often. To work
around any 429: Too Many Requests errors, we can trick Reddit by
specifying our own user agent:
headers  = {'user-agent': 'reddit-{}'.format(os.environ.get('USER', 'cse-20289-sp23'))}
response = requests.get(url, headers=headers)
This should allow you to make requests without getting the dreaded 429 error.
The code above would output something like the following:
{"kind": "Listing", "data": {"modhash": "g8n3uwtdj363d5abd2cbdf61ed1aef6e2825c29dae8c9fa113", "children": [{"kind": "t3", "data": ...
Looking through that stream of text, Katie sees that the JSON data is a
collection of structured or hierarchical dictionaries and lists. This
looks a bit complex to her, so she wants you to help her complete the
reddit.py script which fetches the JSON data for a specified
subreddit or URL and allows the user to sort the articles by various
fields, restrict the number of items displayed, and even shorten the URLs
of each article.
Task 1: reddit.py
The reddit.py script takes the following arguments:
$ ./reddit.py
Usage: reddit.py [options] URL_OR_SUBREDDIT

    -s          Shorten URLs using (default: False)
    -n LIMIT    Number of articles to display (default: 10)
    -o ORDERBY  Field to sort articles by (default: score)
    -t TITLELEN Truncate title to specified length (default: 60)
The -s flag shortens URLs using the is.gd web service. This means
that long URLs are converted into shorter ones such as: https://is.gd/g3QdWp
The -n flag specifies the number of articles to display. By default, this is 10.
The -o flag specifies the Reddit article attribute to use for sorting the
articles. By default this should be score. Note, if the ORDERBY
parameter is score, then the articles should be ordered in descending
order. Otherwise, the articles should be ranked in ascending order.
The -t flag specifies the maximum length for the articles' titles. Titles
longer than this value should be truncated. The default value is 60.
Examples
Here are some examples of reddit.py in action:
# Show Linux subreddit
$ ./reddit.py linux
  1.    Vanilla OS can finish my distro hopping with these subsystem (Score: 915)
  https://i.redd.it/j9hpe2pnw3ja1.png

  2.    The 6.2 kernel has been released (Score: 732)
  https://lwn.net/Articles/923732/

  3.    NEW New Hampshire software freedom bill on 21 February 2023  (Score: 392)
  https://libreboot.org/news/usa-libre-part3.html

  4.    Just submitted my first AUR package to control monitor brigh (Score: 231)
  https://aur.archlinux.org/packages/brightness

  5.    Czkawka 5.1 - Unnecessary file cleaner of unnecessary files, (Score: 102)
  https://www.reddit.com/r/linux/comments/1169jod/czkawka_51_unnecessary_file_cleaner_of/

  6.    Disability accessibility tools for Linux such as eyetrackers (Score: 69)
  https://www.reddit.com/r/linux/comments/116z1r8/disability_accessibility_tools_for_linux_such_as/

  7.    Budgie 10.7.1 Released (Score: 64)
  https://blog.buddiesofbudgie.org/budgie-10-7-1-released/

  8.    Few lesser known tricks, quirks and features of C (Score: 45)
  https://blog.joren.ga/less-known-c

  9.    lastresort(1) – Base 256 codec with easily typed words, vers (Score: 42)
  https://github.com/ctsrc/Base256

  10.   A guide to open source project governance models (Score: 38)
  https://www.redhat.com/en/resources/guide-to-open-source-project-governance-models-overview

# Show top 5 nba articles
$ ./reddit.py -n 5 nba
  1.    [Highlight] Nikola Jokic doesn't want to get picked last as  (Score: 15358)
  https://streamable.com/gafgvm

  2.    [Wojnarowski] After finalizing a contract buyout with the Ut (Score: 11009)
  https://twitter.com/wojespn/status/1627694579540709381

  3.    [Highlight] “These people going to heaven, ain’t nothing to  (Score: 9995)
  https://streamable.com/6it7we

  4.    [Highlight] Damian Lillard casually hits the beyond half cou (Score: 8282)
  https://streamable.com/cwllbi

  5.    [Woike] “That’s not basketball,” Jaylen Brown said. Called t (Score: 6448)
  https://twitter.com/DanWoikeSports/status/1627521703441211394

# Show top 2 Clash Royale articles sorted by title
$ ./reddit.py -n 2 -o title ClashRoyale
  1.    After effects of super magic archer challenge (Score: 39)
  https://i.redd.it/0b0gclkiqcja1.jpg

  2.    Angry bull card idea (Score: 13)
  https://i.redd.it/x3b6ye1x5fja1.png

# Show top 2 unixporn articles sorted by score (with shorten URLs)
$ ./reddit.py -n 2 -o score -s unixporn
  1.    [Hyprland] Carbonfox needs more love (Score: 643)
  https://is.gd/XKBcJY

  2.    [bspwm] with polybar and interactive wallpaper using my own  (Score: 336)
  https://is.gd/HuXNuy
We'll do it live
Note, since we are pulling data from an active website, the articles may change between runs.
Skeleton Code
Here is skeleton code you can use to start your reddit.py script:
# Download reddit.py skeleton
$ curl -LO https://raw.githubusercontent.com/nd-cse-20289-sp23/cse-20289-sp23-assignments/master/homework05/reddit.py
It should look something like this:
import os
import sys

import requests

# Constants

ISGD_URL = 'http://is.gd/create.php'

# Functions

def usage(status=0):
    ''' Display usage information and exit with specified status '''
    print('''Usage: {} [options] URL_OR_SUBREDDIT

    -s          Shorten URLs using (default: False)
    -n LIMIT    Number of articles to display (default: 10)
    -o ORDERBY  Field to sort articles by (default: score)
    -t TITLELEN Truncate title to specified length (default: 60)
    '''.format(os.path.basename(sys.argv[0])))
    sys.exit(status)

def load_reddit_data(url):
    ''' Load reddit data from specified URL into dictionary

    >>> len(load_reddit_data('https://reddit.com/r/nba/.json')) >= 25
    True

    >>> load_reddit_data('linux')[0]['data']['subreddit']
    'linux'
    '''
    return []

def shorten_url(url):
    ''' Shorten URL using is.gd service

    >>> shorten_url('https://reddit.com/r/aoe2')
    'https://is.gd/dL5bBZ'

    >>> shorten_url('https://cse.nd.edu')
    'https://is.gd/3gwUc8'
    '''
    return ''

def print_reddit_data(data, limit=10, orderby='score', titlelen=60, shorten=False):
    ''' Dump reddit data based on specified attributes '''
    pass

def main():
    arguments = sys.argv[1:]
    url       = None
    limit     = 10
    orderby   = 'score'
    titlelen  = 60
    shorten   = False

# Main Execution

if __name__ == '__main__':
    main()
Hints
-
Read the
TODOcomments carefully. DO NOT REMOVE THE doctests! -
load_reddit_data: To fetch the Reddit data, you can use the requests.get method. You can then access the JSON data via thejson()method of the object returned by requests.get. You will need to think carefully about what portion of the JSON you actually want to utilize. -
print_reddit_data: To display the articles, this function can use the sorted function with either thereverseorkeyparameter to order the articles. It can then slice the resulting articles to limit the number of things displayed.Note, a
tabcharacter is used to separate theindexand thetitleand to indent theurl.To sort by a particular field or attribute, you can take advantage of the
keyparameter of the sorted function:articles = sorted(data, key=lambda i: i[field]) -
shorten_url: To shorten a URL, you can use the requests.get method to make a request to the is.gd webservice with the appropriateparamsas shown below:requests.get(ISGD_URL, params={'format': 'json', 'url': url})You will need to parse the result of this request to extract the shortened URL.
Task 2: test_reddit.sh
To aid you in testing the reddit.py script, we have provided you with
test_reddit.sh, which you can use as follows:
$ ./test_reddit.sh
Testing reddit.py ...
   Doctests                                 ... 1.00 / 1.00
   Bad arguments                            ... Success
   -h                                       ... Success
   No arguments                             ... Success
   linuxactionshow                          ... Success
   linuxactionshow (-n 1)                   ... Success
   linuxactionshow (-o url)                 ... Success
   linuxactionshow (-t 10)                  ... Success
   linuxactionshow (-s)                     ... Success
   pop-os                                   ... Success
   pop-os (-n 5)                            ... Success
   pop-os (-n 5 -o title)                   ... Success
   pop-os (-n 5 -o url -t 20)               ... Success
   pop-os (-n 2 -o score -t 40 -s)          ... Success

   Score 5.00 / 5.00
  Status Success
Note, we chose an inactive subreddit, r/linuxactionshow for our test script since it should not change. However, it is possible that it may change5 and thus break our test script. Just let the staff know and adjustments can be made.
Activity 2: CSE Demographics (6 Points)
One of the most pressing questions in Computer Science education is
addressing the lack of diversity in computing. In order to meanfully
examine this issue, we will first need to look at some raw data. For this
activity, you are to a script, demographics.py, that downloads, processes,
and visualizes the Computer Science and Engineering demographic data from
the classes of 2013 through 2025.
Background
For context and background material, you may wish to first read some of the following articles regarding gender and ethnic diversity in Computer Science and the technology industry in general:
Ethical and Professional Issues
This assignment is inspired by a discussion we have in the CSE 40175 Ethical and Professional Issues class, which is a required course for all Computer Science and Engineering students.
Demographic Data
Our beloved Ramzi has graciously provided us with the student demographic data for all Computer Science and Engineering students from the class of 2013 through 2025. This data looks something like this:
$ curl -sL https://yld.me/raw/e2Ad | head -n 10
Year,Gender,Ethnic
2013,M,C
2014,M,C
2015,F,N
2016,F,N
2017,M,C
2018,M,C
2013,M,C
2014,M,S
2015,M,C
As can be seen above, the demographics CSV data has three columns:
-
The first column represents the graduating class year that student belongs to.
-
The second column records the gender of the student and contains either
MorFwhich stands forMaleorFemalerespectively. -
The third column records the ethnicity of the student and consists of the following mapping:
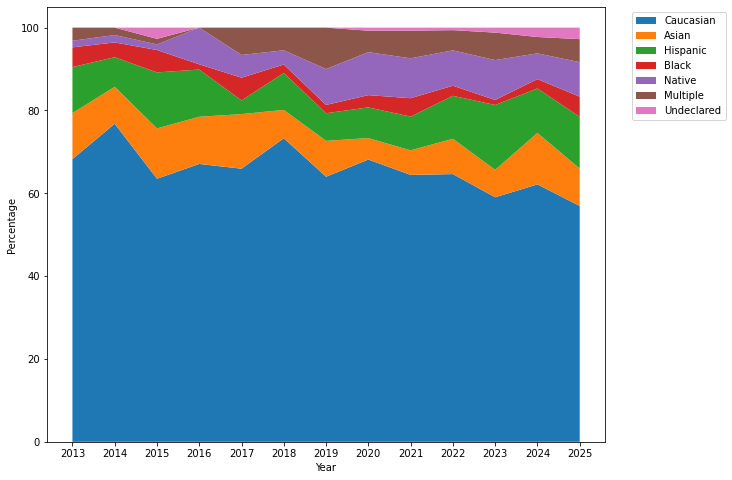
Letter Ethnicity C Caucasian O Asian S Hispanic B Black or African American N Native American / Pacific Islanders T Multiple Selection U Undeclared
Task 1: demographics.py
The demographics.py script takes the following arguments:
# Display usage message
$ ./demographics.py -h
Usage: demographics.py [options] [URL]

    -y  YEARS   Which years to display (default: all)
    -p          Display data as percentages.
    -G          Do not include gender information.
    -E          Do not include ethnic information.
The -y flag specifies which years to display (the default is to display all
the years in the CSV data).
The -p flag forces the script to output data as percentages rather than raw
counts.
The -G and -E flags suppresses outputting the gender and ethnic data
respectively.
The user may specify a URL to the CSV file. If one is not specified then
the script will use https://yld.me/raw/e2Ad as the
URL.
Note, the years are always displayed in ascending order.
Examples
Here are some examples of demographics.py in action:
# No arguments
$ ./demographics.py
2013 2014 2015 2016 2017 2018 2019 2020 2021 2022 2023 2024 2025
================================================================================================================
M 49 44 58 60 65 101 96 92 89 124 114 120 105
F 14 12 16 19 26 45 54 43 46 41 52 57 39
----------------------------------------------------------------------------------------------------------------
B 3 2 4 1 5 3 3 4 6 4 2 4 7
C 43 43 47 53 60 107 96 92 87 106 98 110 82
N 1 1 1 7 5 5 13 14 13 14 16 11 12
O 7 5 9 9 12 10 13 7 8 14 11 22 13
S 7 4 10 9 3 13 10 10 11 17 26 19 18
T 2 1 1 0 6 8 15 7 9 8 11 7 8
U 0 0 2 0 0 0 0 1 1 1 2 4 4
----------------------------------------------------------------------------------------------------------------
# Show percentages rather than raw counts
$ ./demographics.py -p
2013 2014 2015 2016 2017 2018 2019 2020 2021 2022 2023 2024 2025
================================================================================================================
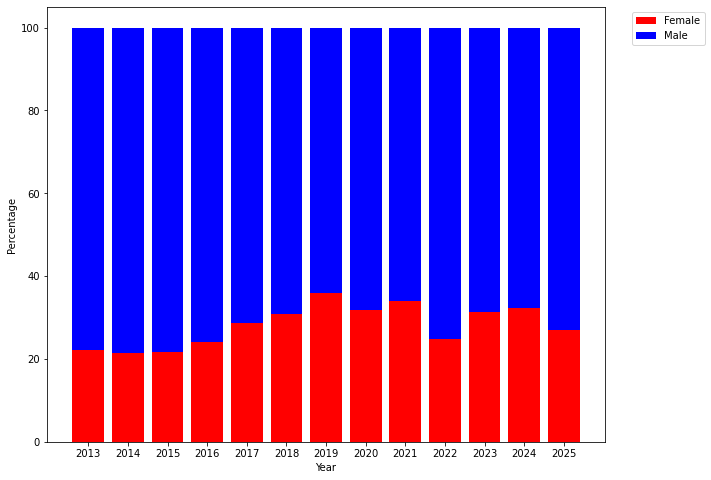
M 77.8% 78.6% 78.4% 75.9% 71.4% 69.2% 64.0% 68.1% 65.9% 75.2% 68.7% 67.8% 72.9%
F 22.2% 21.4% 21.6% 24.1% 28.6% 30.8% 36.0% 31.9% 34.1% 24.8% 31.3% 32.2% 27.1%
----------------------------------------------------------------------------------------------------------------
B 4.8% 3.6% 5.4% 1.3% 5.5% 2.1% 2.0% 3.0% 4.4% 2.4% 1.2% 2.3% 4.9%
C 68.3% 76.8% 63.5% 67.1% 65.9% 73.3% 64.0% 68.1% 64.4% 64.2% 59.0% 62.1% 56.9%
N 1.6% 1.8% 1.4% 8.9% 5.5% 3.4% 8.7% 10.4% 9.6% 8.5% 9.6% 6.2% 8.3%
O 11.1% 8.9% 12.2% 11.4% 13.2% 6.8% 8.7% 5.2% 5.9% 8.5% 6.6% 12.4% 9.0%
S 11.1% 7.1% 13.5% 11.4% 3.3% 8.9% 6.7% 7.4% 8.1% 10.3% 15.7% 10.7% 12.5%
T 3.2% 1.8% 1.4% 0.0% 6.6% 5.5% 10.0% 5.2% 6.7% 4.8% 6.6% 4.0% 5.6%
U 0.0% 0.0% 2.7% 0.0% 0.0% 0.0% 0.0% 0.7% 0.7% 0.6% 1.2% 2.3% 2.8%
----------------------------------------------------------------------------------------------------------------
# Show only gender percentages for the years 2022, 2023, and 2024 (with explicit URL)
$ ./demographics.py -y 2023,2024,2025 -E -p https://yld.me/raw/e2Ad
2023 2024 2025
================================
M 68.7% 67.8% 72.9%
F 31.3% 32.2% 27.1%
--------------------------------
Spacing and Formatting
Note, to pass the provided tests, you must match the spacing and formatting
exactly. Only use spaces to align data (no \t) and make sure you
have no trailing whitespace**.
Formatting hints are provided in the docstrings provided in the skeleton code.
Skeleton Code
Here is skeleton code you can use to start your demographics.py script:
# Download demographics.py skeleton
$ curl -LO https://raw.githubusercontent.com/nd-cse-20289-sp23/cse-20289-sp23-assignments/master/homework05/demographics.py
It should look something like this:
import collections
import os
import sys

import requests

# Constants

URL     = 'https://yld.me/raw/e2Ad'
TAB     = ' '*8
GENDERS = ('M', 'F')
ETHNICS = ('B', 'C', 'N', 'O', 'S', 'T', 'U')

# Functions

def usage(status=0):
    ''' Display usage information and exit with specified status '''
    progname = os.path.basename(sys.argv[0])
    print(f'''Usage: {progname} [options] [URL]

    -y  YEARS   Which years to display (default: all)
    -p          Display data as percentages.
    -G          Do not include gender information.
    -E          Do not include ethnic information.
    ''')
    sys.exit(status)

def load_demo_data(url=URL):
    ''' Load demographics from specified URL into dictionary

    >>> load_demo_data('https://yld.me/raw/ilG').keys()
    dict_keys(['2013', '2014', '2015', '2016', '2017', '2018', '2019'])

    >>> load_demo_data('https://yld.me/raw/ilG')['2013'] == {'M': 1, 'B': 2, 'F': 1, 'TOTAL': 2}
    True

    >>> load_demo_data('https://yld.me/raw/ilG')['2019'] == {'M': 1, 'U': 2, 'F': 1, 'TOTAL': 2}
    True
    '''
    return {}

def print_demo_separator(years, char='='):
    ''' Print demographics separator

    Note: The row consists of the 8 chars for each item in years + 1.

    >>> print_demo_separator(['2012', '2013'])
    ========================
    '''
    print()

def print_demo_years(years):
    ''' Print demographics years row

    Note: The row is prefixed by 4 spaces and each year is right aligned to 8
    spaces ({:>8}).

    >>> print_demo_years(['2012', '2013'])
            2012    2013
    '''
    print()

def print_demo_fields(data, years, fields, percent=False):
    ''' Print demographics information (for particular fields)

    Note: The first column should be a 4-spaced field name ({:>4}), followed by
    8-spaced right aligned data columns ({:>8}).  If `percent` is True, then
    display a percentage ({:>7.1f}%) rather than the raw count.

    >>> data  = load_demo_data('https://yld.me/raw/ilG')
    >>> years = sorted(data.keys())
    >>> print_demo_fields(data, years, GENDERS, False)
       M       1       1       1       1       1       1       1
       F       1       1       1       1       1       1       1
    '''
    print()

def print_demo_data(data, years=None, percent=False, gender=True, ethnic=True):
    ''' Print demographics data for the specified years and attributes '''
    pass

def print_demo_gender(data, years, percent=False):
    ''' Print demographics gender information '''
    print_demo_fields(data, years, GENDERS, percent)
    print_demo_separator(years, '-')

def print_demo_ethnic(data, years, percent=False):
    ''' Print demographics ethnic information '''
    print_demo_fields(data, years, ETHNICS, percent)
    print_demo_separator(years, '-')

def main():
    ''' Parse command line arguments, load data from url, and then print
    demographic data. '''
    arguments = sys.argv[1:]
    url       = URL
    years     = None
    gender    = True
    ethnic    = True
    percent   = False

# Main Execution

if __name__ == '__main__':
    main()
Hints
-
Read the
TODOcomments carefully. DO NOT REMOVE THE doctests! -
load_demo_data: To fetch the demographic data, you can use the requests.get method. You can then access the raw data via thetextproperty of the object returned by requests.get. You will then need to organize the CSV data into a dictionary of the following format:{"year": {"gender": count, "ethnic": count, "TOTAL": count}} -
print_demo_separator: To display a separator line, this function should print 8chars for eachyear + 1. Consider using string multiplication:print(' '*8) # Prints 8 spaces -
print_demo_years: To display the years, this function should use the start with a string with4spaces and then concatenate to this string each year formatted so it is right-aligned to8spaces. You can accomplish alignment by doing the following:# Print the value of variable aligned to the right and taking up at least 8 spaces print(f'{variable:>8}') -
print_demo_fields: To display all the rows for a given list offields, this function should build a row of text column by column. Special care must be taken to display percentages versus raw counts. -
print_demo_data: To display the table of data, this function should call theprint_demo_yearsandprint_demo_separatorfunctions, followed by theprint_demo_genderandprint_demo_ethnicfunctions if necessary. -
print_demo_gender: This function simply calls theprint_demo_fieldsandprint_demo_separatorfunctions and is provided to you. -
print_demo_ethnic: This function simply calls theprint_demo_fieldsandprint_demo_separatorfunctions and is provided to you.
Iterative and incremental development
Do not try to implement everything at once. Instead, approach this activity with the iterative and incremental development mindset and slowly build pieces of your application one feature at a time:
-
Parse the program arguments.
-
Fetch the data from the specified URL and organize into a dictionary.
-
Write the table header.
-
Write one table row based on a field.
Remember that the goal at the end of each iteration is that you have a working program that successfully implements all of the features up to that point.
Focus on one thing at a time and feel free to write small test code to try things out.
Task 2: test_demographics.sh
To aid you in testing the demographics.py script, we have provided you with
test_demographics.sh, which you can use as follows:
$ ./test_demographics.sh
Testing demographics.py ...
   Doctests                                 ... 1.00 / 1.00
   Bad arguments                            ... Success
   -h                                       ... Success
   No arguments                             ... Success
   e2Ad                                     ... Success
   e2Ad -y 2013                             ... Success
   e2Ad -y 2025                             ... Success
   e2Ad -y 2019,2023,2021,2025              ... Success
   e2Ad -p                                  ... Success
   e2Ad -G                                  ... Success
   e2Ad -E                                  ... Success
   ilG                                      ... Success
   ilG -y 2016 -p                           ... Success
   ilG -y 2016 -p -E                        ... Success
   ilG -y 2016 -p -E -G                     ... Success

   Score 6.00 / 6.00
  Status Success
Activity 3: Quiz (1 Point)
Once you have completed all the activities above, you are to complete the following reflection quiz:
As with [Reading 01], you will need to store your answers in a
homework04/answers.json file. You can use the form above to generate the
contents of this file, or you can write the JSON by hand.
To test your quiz, you can use the check.py script:
$ ../.scripts/check.py
Checking homework05 quiz ...
     Q01 0.40
     Q02 0.60
   Score 1.00 / 1.00
  Status Success
Guru Point (1 Point)
For extra credit, you are to visualize the CSE demographics data above as graphical plots using Python and matplotlib inside a Jupyter notebook. You should produce graphs like these:
To run Jupyter on the student machines:, you can use the following command:
$ jupyter-notebook-3.10 --ip studentXX.cse.nd.edu --port 9000 --no-browser
Replace studentXX.cse.nd.edu with the name of the student machine you are
on. Also, you may need to change the port to something else between 9000 -
9999.
Google Colaboratory
Alternatively, you can use Google Colaboratory to run a Jupyter notebook from your Google Drive. This is a hassle-free way to explore developing with Python and matplotlib, while using Google Cloud resources (thus no need for the VPN or the student machines).
Verification
To get credit for this Guru Point, show your Jupyter notebook with the graphical plots to a TA to verify (or attached a video / screenshot to your Pull Request). You have up until a week after this assignment is due to verify your Guru Point.
Self-Service Extension
Remember that you can always forgo this Guru Point for two extra days to do the homework. That is, if you need an extension, you can simply skip the Guru Point and you will automatically have until Monday to complete the assignment for full credit.
Just leave a note on your Pull Request of your intentions.
Submission
To submit your assignment, please commit your work to the homework05 folder
of your homework05 branch in your assignments GitHub repository.
Your homework04 folder should only contain the following files:
Makefileanswers.jsondemographics.pyreddit.py
Note: You do not need to commit the test scripts because the Makefile
automatically downloads them.
#--------------------------------------------------
# BE SURE TO DO THE PREPARATION STEPS IN ACTIVITY 0
#--------------------------------------------------

$ cd homework05                           # Go to Homework 05 directory
...
$ $EDITOR reddit.py                       # Edit script
$ git add reddit.py                       # Mark changes for commit
$ git commit -m "homework05: activity 1"  # Record changes
...
$ $EDITOR demographics.py                 # Edit script
$ git add demographics.py                 # Mark changes for commit
$ git commit -m "homework05: activity 2"  # Record changes
...
$ $EDITOR answers.json                    # Edit quiz
$ git add answers.json                    # Mark changes for commit
$ git commit -m "homework05: activity 3"  # Record changes
...
$ git push -u origin homework05           # Push branch to GitHub
Pull Request
Remember to create a Pull Request and assign the appropriate TA from the Reading 06 TA List.
DO NOT MERGE your own Pull Request. The TAs use open Pull Requests to keep track of which assignments to grade. Closing them yourself will cause a delay in grading and confuse the TAs.