Program 2: Plot
Due: Thursday, September 9, 2010 (before lab session starts)
Write a program, plot, that reads in input data and plots the points using a variety of OpenGL geometric primitives.
Input
The input file will consist of a set of data points in the following format:
x0 y0
x1 y0
...
An example is the following:
0.0 0.0
5.0 3.0
6.0 2.0
7.0 0.0
1.0 1.0
2.0 1.0
3.0 2.0
4.0 4.0
Note
Make no assumption about the order in which the data points appear in the file.
Modes
Your program should plot the data in the following modes:
- Points: plot the data as points.
- Circles: plot the data as circles.
- Line: plot the data as a line.
- Fan: plot the data as a fan.
- Triangles: plot the data as triangles.
- Quads: plot the data as quads.
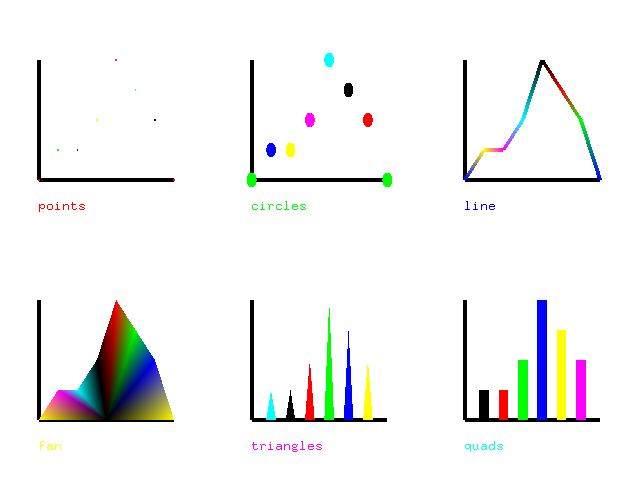
All of the plots should contain colors, axes, and a label describing which mode is being displayed. All modes should be displayed in one window with each mode in its own separate viewport.
Usage
To specify the input data file, your program should have at least the following command line interface:
usage: plot [options] <datafile>
Options:
    -h         Show this help message
An example invocation would be:
$ ./plot input.data
Feel free to add additional flags and options to modify your programs behavior at runtime. Make sure to document these options in the usage message and in your README.
Grading Rubric
Grading for this assignment is out of 10 points:
| Points | Requirement |
|---|---|
| 3 | Program plots data as colored points, circles, line, fan, triangles, and quads. |
| 2 | Plots include axes and are labeled. |
| 2 | Program reads in points from a data file. |
| 1 | Program includes usage message with options displayed. |
| 1 | Submission includes Makefile, source code, and README, each with student's name. |
| 1 | Submission builds and runs on RHEL5 machine. |
Submission
Submit your source code, Makefile, and README to your course dropbox:
/afs/nd.edu/coursefa.10/cse/cse40166.01/dropbox/<afsid>/pgm2