Notebook 04: Functions
Overview
The goal of this assignment is to allow you to practice defining and
utilizing functions in the Python programming language. To record
your solutions and answers, create a new Jupyter Notebook titled
Notebook04.ipynb and use this notebook to complete the following
activities and answer the corresponding questions.
Make sure you label your activities appropriately. That is for Activity 1, have a header cell that is titled Activity 1. Likewise, use the Markdown cells to answer the questions (include the questions above the answer).
This Notebook assignment is due Midnight Thursday, October 1, 2015 and is to be done individually.
Activity 1: Drawing Shapes
For this activity, you will build two functions to generate SVG (Scalable Vector Graphics) code to draw a circle and a square. You will then use these functions inside a third function that will draw one of the shapes based on interactive user inputs provided by Jupyter's interaction module.
SVG
To draw shapes in our Jupyter Notebook, we will need to generate HTML
(Hypertext Markup Language) code, which is what web browsers use to
determine what to display on a web site. For instance, if you right-click
on this page and select View Page Source, you will be shown the HTML
source code for this page:
<!DOCTYPE html>
<html lang="en">
    <head>
      <meta charset="utf-8">
      <meta http-equiv="X-UA-Compatible" content="IE=edge">
      <meta name="viewport" content="width=device-width, initial-scale=1">
      <meta name="description" content="">
      <meta name="author" content="">

      <title>Notebook 04: Functions </title>
      ...
As you can see, HTML involves the use of tags enclosed by angle brackets <> to denote commands. These tags analogous to keywords in Python. Since HTML is just a series of text, we can actually use another programming language such as Python to generate strings of text that contain HTML!
To draw shapes, we will use a language similar to HTML called SVG (Scalable Vector Graphics) which is dedicated to drawing graphics. Most modern web browsers suc as Chrome or Firefox support SVG along side HTML, so try those browsers if the graphics generated in this lab do not work in your normal web browser.
To create a canvas for our SVG drawings, we need to enclose our shape
commands in a <svg> tag:
<svg height="100" width="100">
  <!-- Shape Commands Go Here //-->
</svg>
To draw a circle, we can use the following SVG code inside the SVG tag:
<circle cx="50" cy="50" r="40" stroke="black" stroke-width="3" fill="red" />
The code above produces the following:
To draw a square, we can use the following SVG code inside the SVG tag:
<rect x="25" y="25" width="50" height="50" stroke="orange" stroke-width="3" fill="blue" />
The code above produces the following:
In a Jupyter Notebook, you can display HTML code by using the HTML function along with the display function:
html = '<svg height="100" width="100"><rect x="25" y="25" width="50" height="50" stroke="orange" stroke-width="3" fill="blue" /></svg>'
display(HTML(html))
This activity will require you to program two functions that generate the SVG code corresponding to each shape based on different parameters passed to the functions.
Code Skeleton
The following is a skeleton of the code you must implement to complete this activity.
# Imports
from IPython.display import HTML, display
from IPython.html.widgets.interaction import interact
# Constants
GRAPHIC_WIDTH = 400
GRAPHIC_HEIGHT = 300
STROKE_COLOR = 'black'
STROKE_WIDTH = 0
FILL_COLOR = 'blue'
COLORS = ('red', 'orange', 'yellow', 'green', 'purple', 'blue', 'black', 'white')
# Functions
def draw_circle(x, y, radius, stroke_color=STROKE_COLOR, stroke_width=STROKE_WIDTH, fill_color=FILL_COLOR):
""" Return SVG string corresponding to a circle with the specified parameters """
# TODO
def draw_square(x, y, length, stroke_color=STROKE_COLOR, stroke_width=STROKE_WIDTH, fill_color=FILL_COLOR):
""" Return SVG string corresponding to a square with the specified parameters """
# TODO
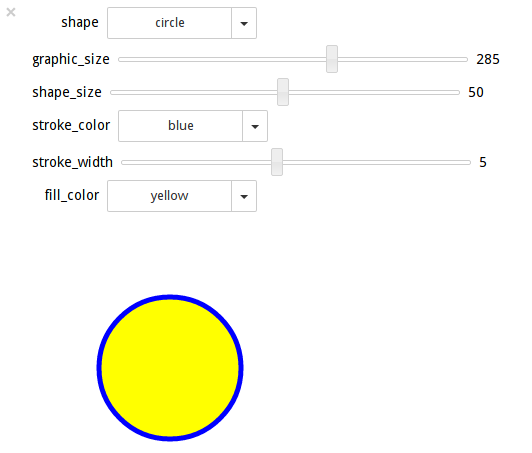
def draw_shape(shape, graphic_size, shape_size, stroke_color, stroke_width, fill_color):
""" Display the HTML code containing the specified shape and parameters """
# TODO
# Run interactive loop
interact(draw_shape, shape=('circle', 'square'), graphic_size=(100, 400), shape_size=(1, 100),
stroke_color=COLORS, stroke_width=(1, 10), fill_color=COLORS)
Interact Module
Some students will need to use the following to import the interact function:
from ipywidgets import interact
If the interact function does not load please contact the instructor
immediately to resolve the issue.
The imports and constants are provided for you, but your are free to modify those to your liking.
As you can see below, there are three functions for you to complete:
-
draw_circle: This function takes thexandycenter coordinates,radius,stroke_color,stroke_width, andfill_colorof the circle and generates a properly formatted string representing the SVG code corresponding to the specified circle. -
draw_square: This function takes thexandytop-left corner coordinates,length,stroke_color,stroke_width, andfill_colorof the square and generates a properly formatted string representing the SVG code corresponding to the specified square. -
draw_shape: This function receives theshapestring,graphic_size,shape_size,stroke_color,stroke_width, andfill_colorfrom the user and generates the appropriate SVG code for the specified shape and parameters.
Your completed program should look like the following:
Hints
-
You can use string formatting to implement
draw_circleanddraw_square. -
For
draw_shape, don't forget to enclose your shape in a SVG tag:<svg width="400" height="300"> <circle cx="5" cy="5" r="5" stroke="blue" stroke-width="2" fill="yellow" /> </svg>The
widthandheightof the SVG corresponds to thegraphic_sizeparameter passed to thedraw_shapefunction. -
For
draw_shape, you should create a variable,htmlthat contains all the HTML code you wish to display. Once all of the HTML code has been generated, you can display it by using thedisplayandHTMLfunctions:display(HTML(html)) # Convert html string into HTML object and then display it in the Notebook -
For
draw_shape, you can use the following equations for drawing a circle:x = width / 2 y = height / 2 radius = shape_size * graphic_size / 100 / 2 -
For
draw_shape, you can use the following equations for drawing a square:length = shape_size * graphic_size / 100 x = width / 2 - length / 2 y = height / 2 - length / 2
Questions
After completing the activity above, answer the following questions:
-
Given the
draw_circleanddraw_squarefunctions above, how would you draw the following shapes:a. A green circle with a red border
b. A yellow square with a purple border
c. A white circle with a black border of width 5
d. A orange square with no border
Answer the question by showing what function call you would make and what parameters you would pass in each function call.
-
Play around with the interactive shape drawer and then explain what the interact function does and what the arguments to interact are. When you adjust the sliders or select an item, what happens?
Activity 2: Visualizing Pi Simulation
For this activity, you are modify your Estimating Pi via Monte Carlo code from Notebook03 by doing the following:
-
Create a function
simulate_pithat takes the number ofdarts,radiusof each dart, thecircle_colorfor each dart inside the circle, and thesquare_colorfor each dart inside the square but not inside the circle as parameters. -
This function should generate a SVG image by performing a Monte Carlo simulation of Pi given the specified number of
darts. -
To visualize the simulation, you should draw a circle with the specified
radiususing thedraw_circlefunction defined in Activity 1 for each dart throw. -
Darts inside the circle should use the
circle_colorparameter as thefill_color, while darts outside the circle should use thesquare_coloras thefill_color.
Code Skeleton
The following is a skeleton of the code you must implement to complete this activity.
# Imports

from IPython.display import HTML, display
from IPython.html.widgets.interaction import interact

import math
import random

# Constants

WIDTH  = 400    # SVG Width
HEIGHT = 400    # SVG Height

# Functions

def simulate_pi(darts, radius, circle_color, square_color):
    """ Display SVG representing Monte Carlo Simulation of Pi """
    # TODO

# Run interactive loop
interact(simulate_pi, darts=(1, 1000), radius=(1, 5), circle_color=COLORS, square_color=COLORS)
Your completed program should look like the following:
Questions
After completing the activity above, answer the following questions:
-
How did you map coordinates of the darts to the SVG canvas. That is, given a
xandycoordinate for the dart throw, how did you translate those coordinates to an circle on the SVG image. -
Play around with the interactive Pi simulator. What happens as you move the
dartsslider? If you move thedartsslider from500to501and then back to500, do you get the same results? Explain.
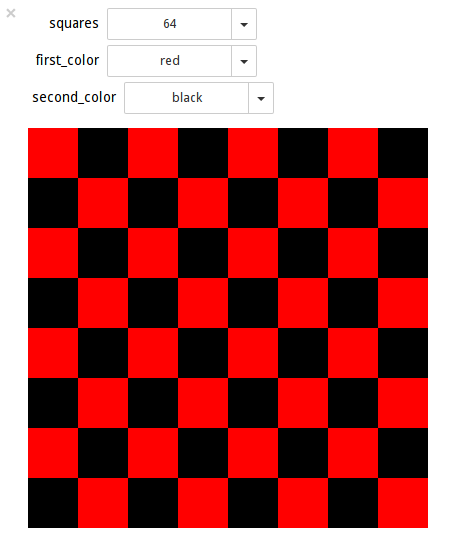
Activity 3: Generating a Chessboard
For this activity, you are to write a function that generates a chessboard
based number of squares specified by the user. While drawing the board,
the function should alternative between the first_color and
second_color specified by the user.
Code Skeleton
The following is a skeleton of the code you must implement to complete this activity.
# Imports

from IPython.display import HTML, display
from IPython.html.widgets.interaction import interact

import math

# Constants

WIDTH  = 400
HEIGHT = 400

# Functions

def generate_chessboard(squares=1, first_color="white", second_color="black"):
    """ Display SVG representing a chessboard """
    # TODO

# Run interactive loop
interact(generate_chessboard, squares={'1':1, '4':4, '9':9, '16':16, '25': 25, '36': 36, '49': 49, '64': 64},
        first_color=COLORS, second_color=COLORS)
Your completed program should look like the following:
Hints
-
You will need to determine the number of
rowsandcolumnsfrom the number ofsquaresspecified by the user. -
You will also need to determine the
widthandheightof each square on the board based on theWIDTHandHEIGHTof the SVG and the number ofrowsandcolumns. -
Use logic similar to what we developed in the chessboard exercise a couple of weeks ago to alternate the colors (
%will be helpfull).
Questions
After completing the activity above, answer the following questions:
-
Explain how your program draws alternating squares of different colors. What was your logic?
-
Play around with the interactive chessboard generator. Notice that the parameter to interact for
squaresis a dictionary containing perfect squares. Change this to a simple integer slider as we did fordartsin Activity 2. How does this change effect your chessboard generator?
Extra Credit
For extra credit, modify your Calculating Mortgage Payments code from Notebook03 and make it interactive using the interact module. Allow users to specify the interest rate, payment, and principal. Instead of a graphic, generate a HTML table with a summary message of the total amount paid and the length of time underneath the table.
Submission
To submit your notebook, follow the same directions for Notebook00, except store this notebook in the notebook04 folder.