Notebook 08: Data Manipulation
Overview
The goal of this assignment is to allow you to practice manipulating data in CSV and JSON format using the Python programming language. Additionally, you will have an opportunity for open-ended exploration.
To record your solutions and answers, create a new Jupyter Notebook
titled Notebook08.ipynb and use this notebook to complete the following
activities and answer the corresponding questions.
Make sure you label your activities appropriately. That is for Activity 1, have a header cell that is titled Activity 1. Likewise, use the Markdown cells to answer the questions (include the questions above the answer).
This Notebook assignment is due midnight Friday, November 4, 2015 and is to be done individually or in pairs.
Partners
Both members of each pair should submit a Notebook. Be sure to identify your partner at the top of the Notebook.
Activity 0: Utilities
To help you complete this Notebook, here are the solutions to Activity
0 of Notebook 07 along with an additional download_file function we
wrote in class:
# Imports

import os
import requests
import zipfile
import StringIO

# Functions

def ls(path=os.curdir, sort=True):
    ''' Lists the contents of directory specified by path '''
    filelist = os.listdir(path)
    if sort:
        filelist.sort()

    for filename in filelist:
        print filename

def head(path, n=10):
    ''' Lists the first n lines of file specified by path '''
    for count, line in enumerate(open(path, 'r')):
        if count >= n:
            break

        line = line.strip()
        print line

def tail(path, n=10):
    ''' Lists the last n lines of file specified by path '''
    for line in open(path, 'r').readlines()[-n:]:
        line = line.strip()
        print line

def download_and_extract_zipfile(url, destdir):
    ''' Downloads zip file from url and extracts the contents to destdir '''
    # Request URL and open response content as ZipFile
    print 'Downloading {} ...'.format(url)
    response = requests.get(url)
    zipdata  = zipfile.ZipFile(StringIO.StringIO(response.content))

    # Extract all zip data to destdir
    print 'Extracting {} ...'.format(url)
    zipdata.extractall(destdir)

def download_file(url, path):
    ''' Downloads URL and saves it to file path '''
    r = requests.get(url)   # Fetch data at url and store in r
    with open(path, 'w') as fh:
        fh.write(r.content) # Write contents of response to file
Feel free to use these functions to help you retrieve and explore the datasets in the following activities.
Activity 1: Data.gov
The first activity is to explore data from the Data.gov website:
Data.gov aims to improve public access to high value, machine readable datasets generated by the Executive Branch of the Federal Government. The site is a repository for federal government information, made available to the public. -- Wikipedia
This is basically a large repository of information collected from federal and state governments.
Your goal for this activity is to explore one CSV dataset from Data.gov by asking two questions and then writing code to help answer them.
For instance, you may wish to explore the following questions?
-
What colleges or universities perform well in the College Scorecard? How does Notre Dame compare to its aspirational peers?
-
What post secondary instituations are in your hometown or state? How many schools have the word College in their name rather than University?
-
How much money is given to Leadership PAC? What is the average funding size?
-
What years have seen the most submissions of Constitutional Amendments? Who has submitted the most? From which state?
Feel free to explore other datasets from the Data.gov website. The possibilities are endless!
Example
Here is the example we performed on the NYC Social Media Usage dataset:
%matplotlib inline

# Imports

import csv
import matplotlib.pyplot as plt

# Constants

DATASET_URL  = 'https://data.cityofnewyork.us/api/views/5b3a-rs48/rows.csv?accessType=DOWNLOAD'
DATASET_FILE = 'nyc.csv'

# Functions

def count_platforms(path):
    ''' Return a dictionary that contains how many likes per platform '''
    counts = {}

    for row in csv.reader(open(path):
        try:
            agency, platform, url, data, likes = row
            platform = platform.title()
            platform = platform.split()[0]

            if platform == 'Total':
                continue

            counts[platform] = counts.get(platform, 0) + int(likes)
        except ValueError:
            pass # Ignore error and keep going

    return counts

def plot_platforms(platforms):
    ''' Plots dictionary that contains how many likes per platform '''
    plats = platforms.keys()
    likes = platforms.values()

    plt.figure(figsize=(10, 8))
    plt.bar(range(len(plats)), likes, linewidth=2, align='center', color='rgbcymk')
    plt.xticks(range(len(plats)), plats, fontsize=12, rotation='vertical')

# Data Processing

# 1. Download CSV file from
download_file(DATASET_URL, DATASET_FILE)

# 2. Perform counts of likes per platform
PLATFORMS = count_platforms(DATASET_FILE)

# 3. Plot counts
plot_platforms(PLATFORMS)
After running the code, you should see a graph that looks like this:
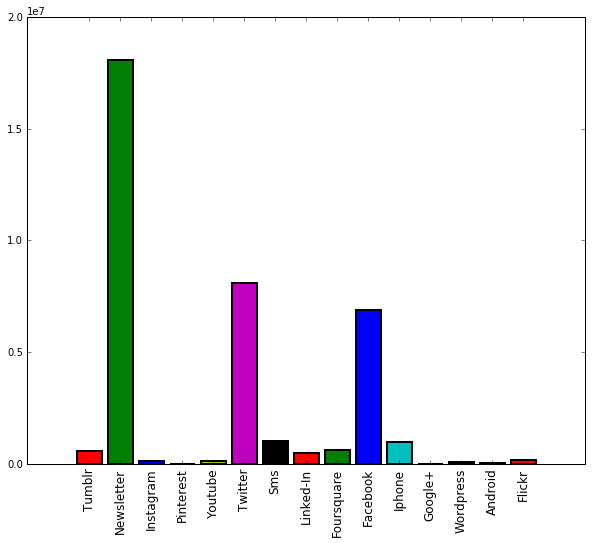
This information can then be used to answer questions such as:
-
Which social media platform is most popular?
-
Which mobile platform is the most popular?
-
Given a limited budget, which platforms should NYC focus on? Which ones should it abandon?
Hints
The following are hints and suggestions that will help you complete this activity:
-
When searching for a data set, you may wish to filter the results by file format (ie. CSV). You may also use the web interface to browse the data before downloading it.
-
For some datasets, you will need to use the csv module rather than str.split to process each row or line of data appropriately.
-
Break up your data processing into small steps where each step corresponds to a function. This way, you can test single functions and abstract some of the complexity of what you are doing.
Questions
After completing the activity above, answer the following questions:
-
Describe the dataset you explored and the two questions you investigated.
-
For each question, explain how you used code to manipulate the data in order to explore the dataset and answer your questions, and discuss the answer you came up with based on your exploration.
-
What challenges did you face and how did you overcome these obstables? What sort of questions were difficult to ask?
Notebook Clean-up
Please clean-up the final Notebook you submit so it only holds the relevant code and explanations (rather than all your experiments).Activity 2: Internet Archive
The second activity is to examine the meta-data of a number of San Fransico Newspapers in order to produce a WordCloud. This means you will have to fetch and process JSON data from the Internet Archive. In particular, you will be examining newspaper articles from the following collections:
To do this, you are to write the following functions:
-
collection_url(collection):Given a string
collectionthat corresponds to one of the eight newspaper collection ids above, this function returns a string URL that looks like this:https://archive.org/advancedsearch.php?q={collection}&rows=1000&output=json -
count_subjects(url, blocklist=[]):Give a string
urland ablocklist, this function returns a dictionary that contains the frequencey of each subject from each documents' meta-data retrieved from the list corresponding to theurl. Theblocklistis used to filter out uninteresting words (that is, these subjects should not be recorded in the dictionary). -
save_subjects(subjects, path):Given a dictionary of
subjectsand apath, this function writes the dictionary to the filepathin CSV format.Be sure to include the header at the top of the CSV file.
-
make_subjects_wordcloud(subjects):Given a dictionary of
subjects, this function generates and shows a WordCloud based on the frequencies in the dictionary.Note: This is provided to you.
Code Skeleton
The following is a skeleton of the code you must implement to complete this activity.
%matplotlib inline

# Imports

import requests
import wordcloud
import matplotlib.pyplot as plt

# Functions

def collection_url(collection):
    ''' Returns a string that corresponds to the URL for the
    collection's JSON data

        >>> collection_url('potreroview')
        'https://archive.org/advancedsearch.php?q=potreroview&rows=1000&output=json'

        >>> collection_url('tenderlointimes')
        'https://archive.org/advancedsearch.php?q=tenderlointimes&rows=1000&output=json'
    '''
    # TODO

def count_subjects(url, blocklist=[]):
    ''' Returns a dictionary that contains the frequency of each
    subject from each article in the documents' meta-data retrieved
    from the URL.
    '''
    # TODO: Fetch data using requests.get

    # TODO: Extract JSON data to variable

    # TODO: Loop through 'docs' list in JSON data
    #
    #       For each document, loop through subjects and count how
    #       often each subject appears.  Do not count any subjects that
    #       are in the blocklist.

    # TODO: Return complete count

def save_subjects(subjects, path):
    ''' Write subjects dictionary in to specified file path in CSV format:

      Subject,Count

    '''
    # TODO

def make_subjects_wordcloud(subjects):
    ''' Generate Word Cloud of Subjects Frequencies '''
    wc = wordcloud.WordCloud().generate_from_frequencies(subjects.items())

    plt.figure(figsize=(12, 9))
    plt.imshow(wc)
    plt.axis('off')

# Data Processing

PAPER_NAME      = 'potreroview'
PAPER_URL       =  collection_url(PAPER_NAME)
PAPER_BLOCKLIST = {
  'library',
  'ten years ago',
  'classifieds',
  'arts & entertainment',
  'classified ads',
  'quickview',
  'crime',
  'art',
  'history',
}
PAPER_SUBJECTS  = count_subjects(PAPER_URL, PAPER_BLOCKLIST)

save_subjects(PAPER_SUBJECTS, PAPER_NAME + '.csv')
make_subjects_wordcloud(PAPER_SUBJECTS)
After running the code, you should see a WordCloud that looks like this:
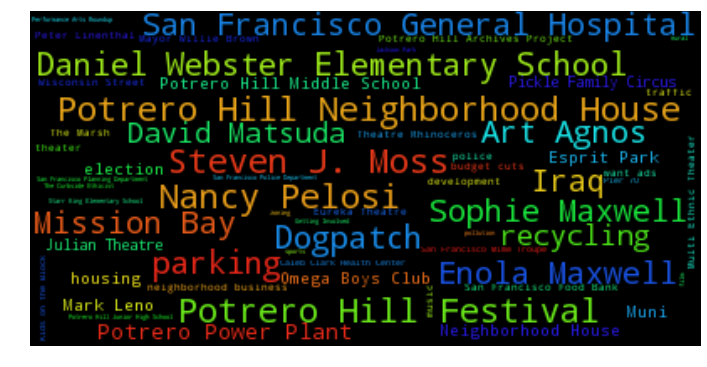
Moreover, you should have a potreroview.csv file that you have written and looks like this:
Subject,Counts
"school boycott",2
"St. Teresa's",6
"Election endorsements",1
"Maritime history",1
...
"academic focus for Potrero Hill Middle School",1
"San Francisco Bicycle Coalition",1
"gardens",5
"Modern Puppetry Festival",1
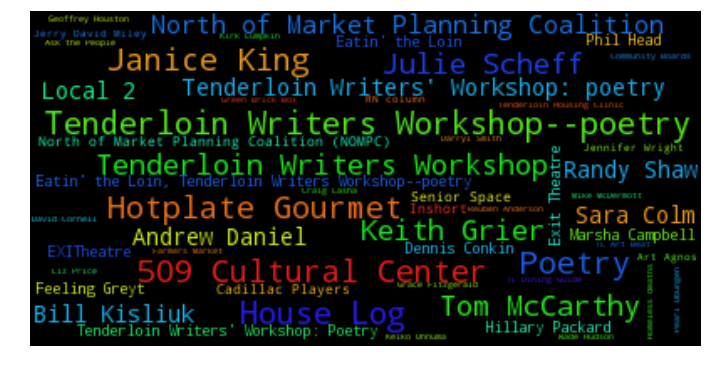
If you changed PAPER_NAME to tenderlointimes, you should see a
WordCloud that looks like this (after tweaking the blocklist):
Hints
The following are hints and suggestions that will help you complete this activity:
-
In order to produce a WordCloud, you will need to install the
wordcloudpackage be running either of the following commands:!pip install wordcloudAlternatively, you can try:
!conda install -c https://conda.anaconda.org/amueller wordcloudOnce this is done, you should be able to
import wordcloud.Windows Users
For Windows users, you may need to do the following instead:
-
Download the
wordcloud-1.2.1-cp27-cp27m-win_amd64.whlfile from this webpage: -
Put this file in the same folder as your notebook and run the following command:
!pip install wordcloud-1.2.1-cp27-cp27m-win_amd64.whl
-
-
Explore the JSON data one level at a time. Remember that JSON is simply a dictionary that may have values that are strings, ints, lists, or other dictionaries. Examine the JSON data by printing the keys or looping through lists, one level at a time until you are confident in how to navigate the data.
-
If you get a
UnicodeEncodeErrorwhile writing to a file, add.encode('utf-8')to the end of the string you are trying to write.
Questions
After completing the activity above, answer the following questions:
-
Describe the contents of the Internet Archive's collection JSON data. How did you extract the list of documents associated with each collection?
-
How did you process each subject in each document? Describe how you built the subjects frequency table.
-
Use your code to generate a WordCloud for each newspaper. Tweak each WordCloud by creating a blocklist of uninteresting terms for each newspaper (as shown in the example above). Did you find anything interesting about the subjects in the newspapers?
Submission
To submit your notebook, follow the same directions for Notebook 01, except store this notebook in the notebook08 folder.