Reading 04: Generating Documents
Readings
The readings for Wednesday, February 15 are:
-
Notre Dame has a site license for this website, which is a great tool for interactive and collaborative LaTeX document editting. The website also provides great documentation:
You should skim these tutorials and take a look at the sample latex file which will generate the sample pdf.
TL;DR
The focus of this reading is to walk you through using LaTeX and gnuplot to generate a document about diversity in Computer Science.
Optional Resources
Activity: Diversity in Computer Science
After skimming the ShareLaTeX tutorials, you should perform the following tasks:
-
Extract gender and ethnicity data from a CSV file using shell scripts.
-
Generate plots from the extracted data using gnuplot.
-
Compose a report incorporating these diagrams using LaTeX.
Background
For context and background material, you may wish to first read some of the following articles regarding gender and ethnic diversity in Computer Science and the technology industry in general:
-
Google finally discloses its diversity record, and it's not good
-
Masculine culture responsible for keeping women out of computer science, engineering
Ethical and Professional Issues
This assignment is inspired by a discussion we have in the CSE 40175: Ethical and Professional Issues class, which is a required course for all Computer Science and Engineering students.
Demographics Data
Our beloved Ramzi has graciously provided us with the student demographic data for all Computer Science and Engineering students from the class of 2013 through 2019. This data looks something like this:
2013,,2014,,2015,,2016,,2017,,2018,,2019,
M,C,M,C,F,N,F,N,M,C,M,N,M,C
M,C,M,S,M,C,M,C,M,N,M,C,F,S
M,C,M,C,M,C,F,C,F,N,M,C,F,S
M,C,M,C,M,C,M,N,M,C,M,C,F,T
M,C,M,C,M,C,F,C,M,C,M,C,M,O
F,C,M,C,M,C,F,N,F,C,M,C,M,S
M,C,M,C,M,C,F,C,M,C,M,N,M,C
M,C,M,C,M,O,F,C,M,C,M,C,M,C
M,O,M,C,F,O,M,C,M,C,M,C,M,C
...
As can be seen above, the demographics.csv file has two columns for each class:
-
The first column records the gender and contains either
MorFwhich stands forMaleorFemalerespectively. -
The second column records the ethnicity and consists of the following mapping:
Letter Ethnicity C Caucasian O Asian S Hispanic B African American N Native American T Multiple Selection U Undeclared
To create graphs that summarize this data, you need to first complete the
provided shell scripts, which extract that data from the demographics.csv
file. Once you have these scripts and can extract the data, you are to
generate graphs and write a report that answers the following questions:
-
What is the overall trend in gender balance in the Computer Science and Engineering program at the University of Notre Dame?
-
How has ethnic diversity changed over time in the Computer Science and Engineering program at the University of Notre Dame?
Task 0: Starter Code
To help you get started on this assignment, the instructor has provided some starter code that you need to download and extract:
# Go to assignments repository
$ cd path/to/repository

# Download tarball
$ curl -LO https://www3.nd.edu/~pbui/teaching/cse.20289.sp17/static/tar/reading04.tar.gz

# Extract tarball
$ tar xvzf reading04.tar.gz

# Remove tarball
$ rm -f reading04.tar.gz
After extracting the reading04.tar.gz you should have the following files:
reading04
  \_ Makefile         # Makefile for activity
  \_ README.md        # README for activity
  \_ ethnic.plt       # Ethnicities gnuplot script
  \_ ethnic.sh        # Ethnicities shell script
  \_ gender.plt       # Gender gnuplot script
  \_ gender.sh        # Gender shell script
  \_ reading04.tex    # Reading 04 LaTeX document
The following tasks will walk you through editing and executing these files in order to build your report document.
Task 1: gender.sh
For this task, you are to complete the gender.sh script:
#!/bin/sh

# gender.sh

URL=https://www3.nd.edu/~pbui/teaching/cse.20289.sp17/static/csv/demographics.csv

count_gender() {
    column= # TODO: Determine appropriate column from first argument
    gender= # TODO: Gender is second argument
    # TODO extract gender data for specified year and group
}

for year in $(seq 2013 2019); do
    echo $year $(count_gender $year F) $(count_gender $year M)
done
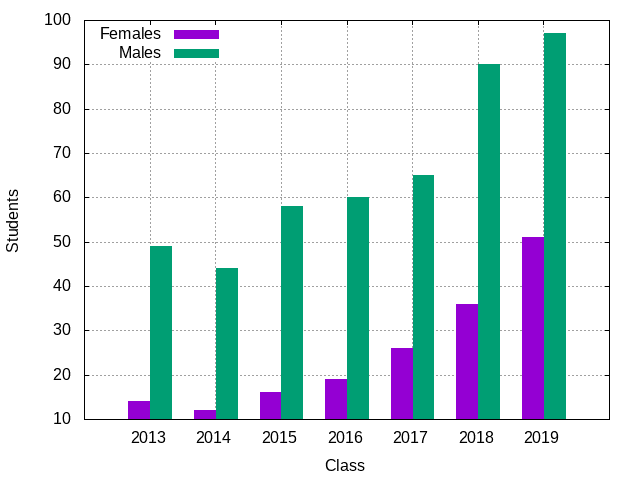
The purpose of this script is to extract all of the gender data (ie. counts of females and males) corresponding to each year as shown below:
$ ./gender.sh
2013 14 49
2014 12 44
2015 16 58
2016 19 60
2017 26 65
2018 36 90
2019 51 97
As you can see, this script calls the count_gender function for each year
between 2013 and 2019 on both the F and M symbols.
The count_gender function takes two arguments:
-
The first argument corresponds to the
year(i.e.2013) and is used to determine whichcolumnin the CSV file the function should extract.For instance, the gender column for the year
2013is1, while the gender column for the year2014is3.You will need to write an arithmetic expression that determines the appropriate
columnbased on the givenyear. -
The second argument corresponds to the
gendersymbol (ie.ForM)
Once you have determined the appropriate column number and gender symbol,
you should compose a pipeline that uses this information to compute the
count of specified gender in the given year.
Hints
-
Remember that an arithmetic expression takes the form of
$((expression)). -
You will probably want to use some combination of curl, cut, sed, grep, and wc.
-
Interactively test your pipeline in the shell before completing the script.
Task 2: ethnic.sh
For this task, you are to complete the ethnic.sh script:
#!/bin/sh

# ethnic.sh

URL=https://www3.nd.edu/~pbui/teaching/cse.20289.sp17/static/csv/demographics.csv

count_ethnic() {
    column= # TODO: Determine appropriate column from first argument
    ethnic= # TODO: Ethnic group is second argument
    # TODO extract ethnic data for specified year and group
}

for year in $(seq 2013 2019); do
    echo $year $(count_ethnic $year C) \
            $(count_ethnic $year O) \
            $(count_ethnic $year S) \
            $(count_ethnic $year B) \
            $(count_ethnic $year N) \
            $(count_ethnic $year T) \
            $(count_ethnic $year U)
done
Similar to the gender.sh script, the purpose of this script is to extract
all of the ethnic data (ie. counts of the different ethnicities)
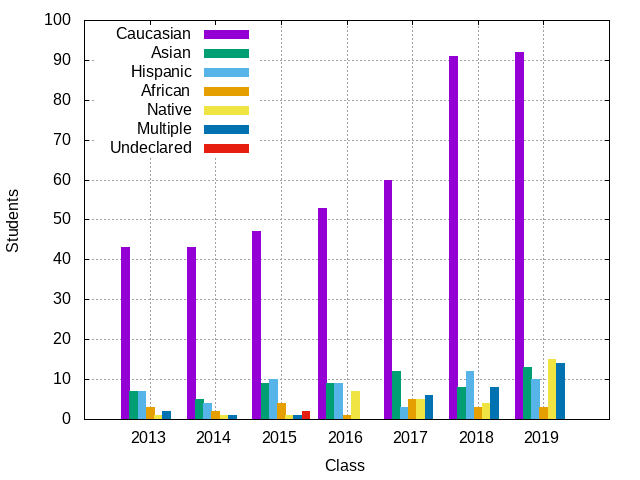
corresponding to each year as shown below:
$ ./ethnic.sh
2013 43 7 7 3 1 2 0
2014 43 5 4 2 1 1 0
2015 47 9 10 4 1 1 2
2016 53 9 9 1 7 0 0
2017 60 12 3 5 5 6 0
2018 91 8 12 3 4 8 0
2019 92 13 10 3 15 14 0
As you can see, this script calls the count_ethnic function for each year
between 2013 and 2019 on all the ethnic group symbols (ie. C, O, S,
B, N, T, and U).
The count_ethnic function takes two arguments:
-
The first argument corresponds to the
year(i.e.2013) and is used to determine whichcolumnin the CSV file the function should extract.For instance, the ethnic column for the year
2013is2, while the ethnic column for the year2014is4.You will need to write an arithmetic expression that determines the appropriate
columnbased on the givenyear. -
The second argument corresponds to the
ethnicsymbol.
Once you have determined the appropriate column number and ethnic symbol,
you should compose a pipeline that uses this information to compute the
count for the specified ethnic group in the given year.
Task 3: gender.plt
Once you have the gender.sh working, you can generate the gender.png
graph by invoking the Makefile using the make command:
$ make gender.png
./gender.sh > gender.dat
gnuplot < gender.plt > gender.png
As you can see, this command will use the gender.sh script to produce the
gender.dat file that contains the results of your data extraction. This
file is in turn used by the gender.plt gnuplot script to produce the
gender.png file, which should look like this:
Although you do not have to, feel free to modify the gender.plt script to
tweak the diagram to your liking.
Task 4: ethnic.plt
Similarly, once you have the ethnic.sh working, you can generate the
ethnic.png graph by invoking the Makefile using the make command:
$ make ethnic.png
./ethnic.sh > ethnic.dat
gnuplot < ethnic.plt > ethnic.png
As you can see, this command will use the ethnic.sh script to produce the
ethnic.dat file that contains the results of your data extraction. This
file is in turn used by the ethnic.plt gnuplot script to produce the
ethnic.png file, which should look like this:
rlthough you do not have to, feel free to modify the ethnic.plt script to
tweak the diagram to your liking.
Task 5: reading04.tex
Finally, once you have the two diagrams above, you are to write edit the
reading04.tex file to create a report using LaTeX with the following
sections:
-
Title: This should contain the title of your report, the date, and your name and email address.
-
Overview: This provides a brief overview (a paragraph) of what you did, how you did it, what you discovered, and what your main takeaway was.
-
Methodology: This briefly describes how you processed the
demographics.csvdata and how you produced the graphs. In particular, it should discuss any interesting or frustrating problems you faced and how you overcame them. You may include code listings of your shell scripts if you wish (as long as you provide some description to accompany the code). -
Analysis: This should provide tables that summarize the
demographics.csvdata and graphs that provide insight into the two questions above. You should accompany these tables and graphs with some commentary on the meaning of the data and plots. -
Discussion: This final section is an opportunity for you to reflect on the issue of creating a welcoming and supportive learning environment at the University of Notre Dame. For instance, you may wish to discuss any of the following questions:
-
Are the issues of gender and ethnic diversity important to you? Should the department work to increase diversity? Should the technology industry try to improve workplace diversity? Why or why not?
-
Does the Computer Science and Engineering department provide a welcoming and supportive learning environment to all students? In what ways can it improve?
-
What challenges have you experienced thus far in the Computer Science and Engineering program? How could the department or university better support you?
-
To build the reading04.pdf file, you can use the following make command:
$ make reading04.pdf
pdflatex reading04.tex
...
To clean up the whole project, simply do:
$ make clean
rm -f gender.dat ethnic.dat gender.png ethnic.png reading04.pdf reading04.log reading04.aux reading04.out
You can rebuild everything by simply running make:
$ make
./gender.sh > gender.dat
gnuplot < gender.plt > gender.png
./ethnic.sh > ethnic.dat
gnuplot < ethnic.plt > ethnic.png
pdflatex reading04.tex
ShareLaTeX
Feel free to use ShareLaTeX to compose your document. That said, you must
download the LaTeX document from the website and include it in your
repository. Moreover, you must ensure the document builds with the make
command.
Feedback
If you have any questions, comments, or concerns regarding the course, please provide your feedback at the end of your response.
Submission
To submit your assignment, please commit your work to the reading04 folder
in your Assignments GitLab repository. Your reading04 folder should
only contain the following files:
-
Makefile -
gender.sh -
ethnic.sh -
gender.plt -
ethnic.plt -
reading04.tex