Visualizations by League
Injuries in the NFL

This graph shows us what the most common injuries are in the NFL. As we can see the NFL chooses to not disclose a plurality of injuries which may mean a number of things. The next three most common injuries are all leg related. This includes Knee, Ankle, and Knee-ACL. Using this information we know to put more protections on leg related injuries. (specifically involving the knees).
Injuries in the MLB

This pie chart shows us the most common injuries within the MLB. The two most common by far are Elbow and Shoulder related injuries. This makes sense for Baseball since between pitching and swinging, most of the movement within the sport is being done with the arms. The MLB can use this data and put resources into treatment and prevention methods for these injuries.
Injuries in the NBA

The pie chart here shows us the most common injuries within the NBA. We can see that the knee and ankle are the most common injuries for basketball. A possible reason for this is that with all the back and forth movement in Basketball, the ankle and the knee are under a lot of stress as major joints within the leg.
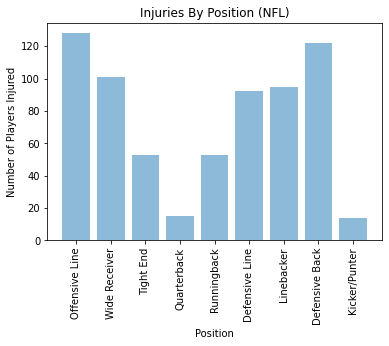
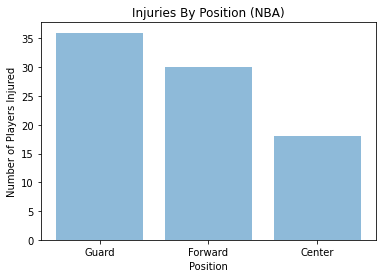
The above three bar charts are comparing the number of injuries per position in each respective league. In the MLB, there is a clear disparity in the number of injuries by position, with pitchers representing the position with the most injuries. In the NBA, the frequency of injuries by position is less variable, with guards representing the position with the most injuries. In the NFL, there is a clear disparity in the number of injuries by positions who are subject to the most contact vs. those who are subject to the least. For example, quarterbacks and kickers/punters suffer the least amount of injuries, which is due to the fact that they are subject to the least amount of contact and have the most protection from penalties.