Visualizations Between Leagues
Total Number of Injuries by League
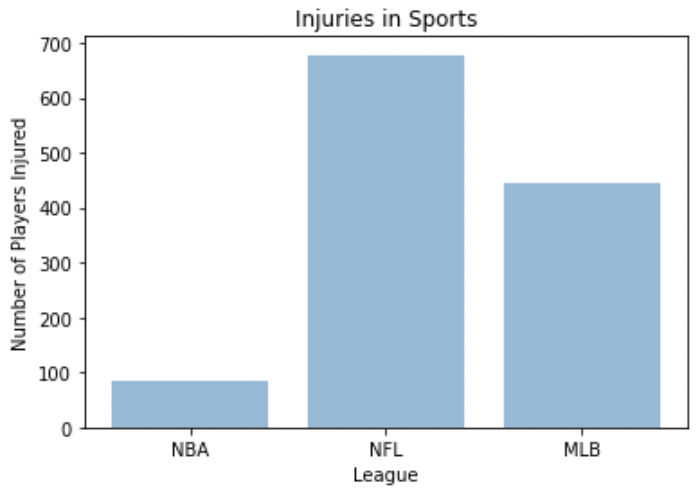
Above is a bar chart, comparing the number of injured players in the NBA, NFL, and MLB. As you can see, the NFL has the most injuries due to the high level of contact in the sport, whereas the NBA has the least amount of injuries.
Number of Illness Related Injuries by league
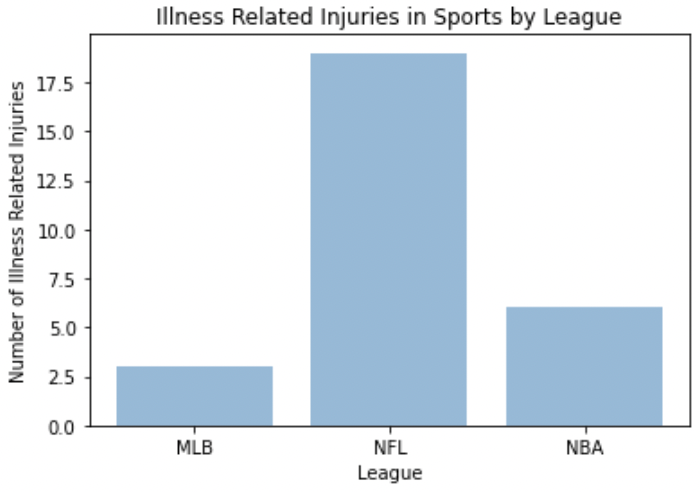
Above is a bar chart, comparing the number of illness related injuries in the NBA, NFL, and MLB. With the emergence of the COVID-19 pandemic, these numbers have experienced an increase in the last couple of years. As you can see, the NFL has the highest number of illness related injuries by a large margin, and the MLB has the lowest. This could be due to football involving frequent contact, whereas baseball is played more spread out without direct contact for the most part.
Tpyes of Injury on the Body

Below is a grouped bar chart, comparing the frequency of injuries between the NBA, NFL, and MLB. Each bar represents the percentage that body part is injured compared to the total amount of injuries in the respective leagues. This is to eliminate any skewed results, considering that there are much greater amounts of injuries in the MLB and NFL compared to the NBA. The diagram above represents more specifically what types of injuries are accounted for in each category on the x-axis. As you can see, football, the sport involving the most contact, has the greatest percentage of head injuries. Basketball, the sport involving the most jumping, has the greatest percentage of injuries below the knee. Baseball, the sport involving the most throwing, has the greatest percentage of arm injuries, by a very large margin.