Motels4Now is a housing-first program created in August 2020 that houses the chronically homeless in dignity and is helping many move into more long-term, month-to-month housing.

Motels4Now is a housing-first program created in August 2020 that houses the chronically homeless in dignity and is helping many move into more long-term, month-to-month housing.

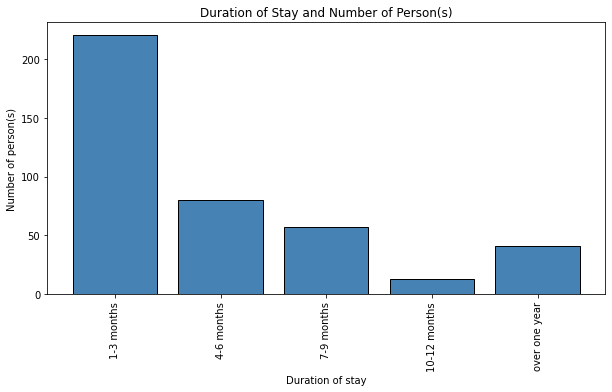
Here is a bar graph that shows some basic, but important information on the length of stays for various individuals. In this graph, we aim to see that Motels4Now as an organization appears to be doing a solid job at placing homeless individuals into more permanent residences.

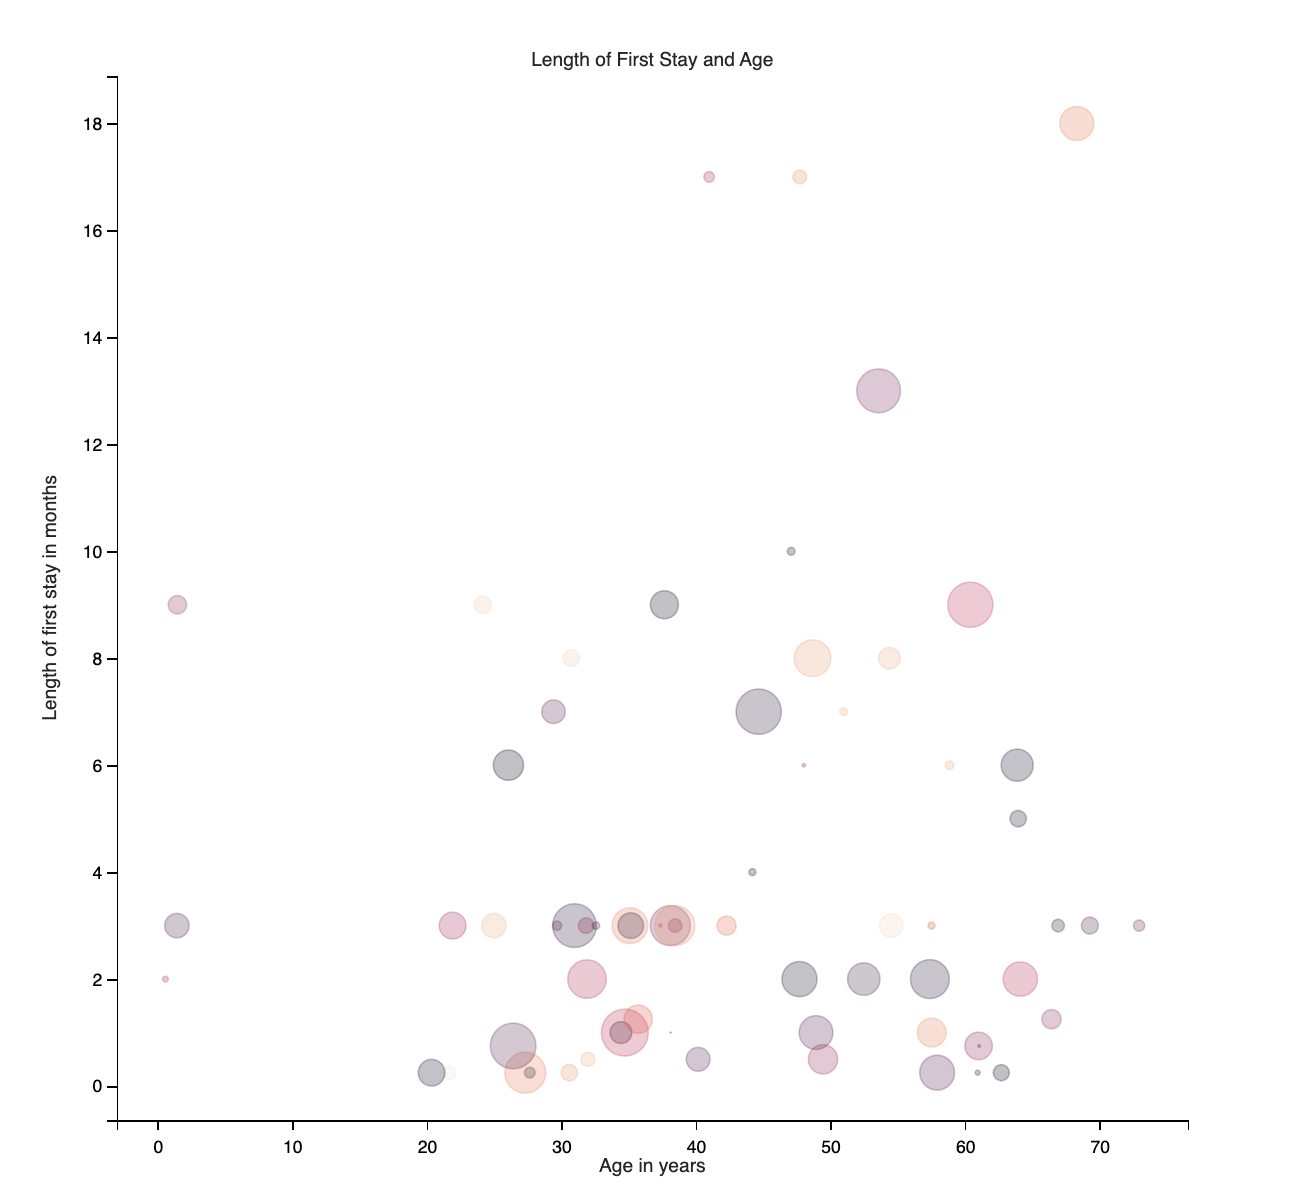
Here is a scatter plot that details the length of the first stay and age. This information sees a diagonal line. It's interesting to note that many young individuals had shorter stays, and older individuals were concentrated in longer stays.

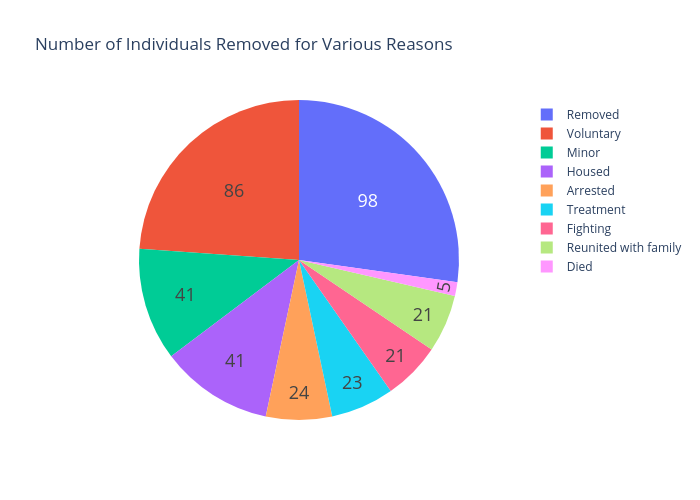
Here is a pie chart depicting the number of individuals removed for various reasons. This is important to have because it supplements the previous graph, and offers further insight onto any potential reasons why people may have left.
It's important to note that if somebody was voluntary removed, that's typically a good sign! It means that they potentially have a grasp on future housing plans.
Although there may not be a ton of visualizations for this dataset, there are some various
important takeaways one should draw from this graph. The visualization detailing the reasons for removal
can show the problems that lie within the homeless community. For example, there was a lot of violence
as a reason why individuals were removed.
Information like this can be hard to find a trend, even with a non-profit that is making a substantial and
positive impact in eradicating the homelessness problem that plagues the local area. Hopefully this
information serves to help!